Immigrants from Dominican Republic vs Belgian Per Capita Income
COMPARE
Immigrants from Dominican Republic
Belgian
Per Capita Income
Per Capita Income Comparison
Immigrants from Dominican Republic
Belgians
$37,306
PER CAPITA INCOME
0.1/ 100
METRIC RATING
295th/ 347
METRIC RANK
$43,951
PER CAPITA INCOME
58.1/ 100
METRIC RATING
168th/ 347
METRIC RANK
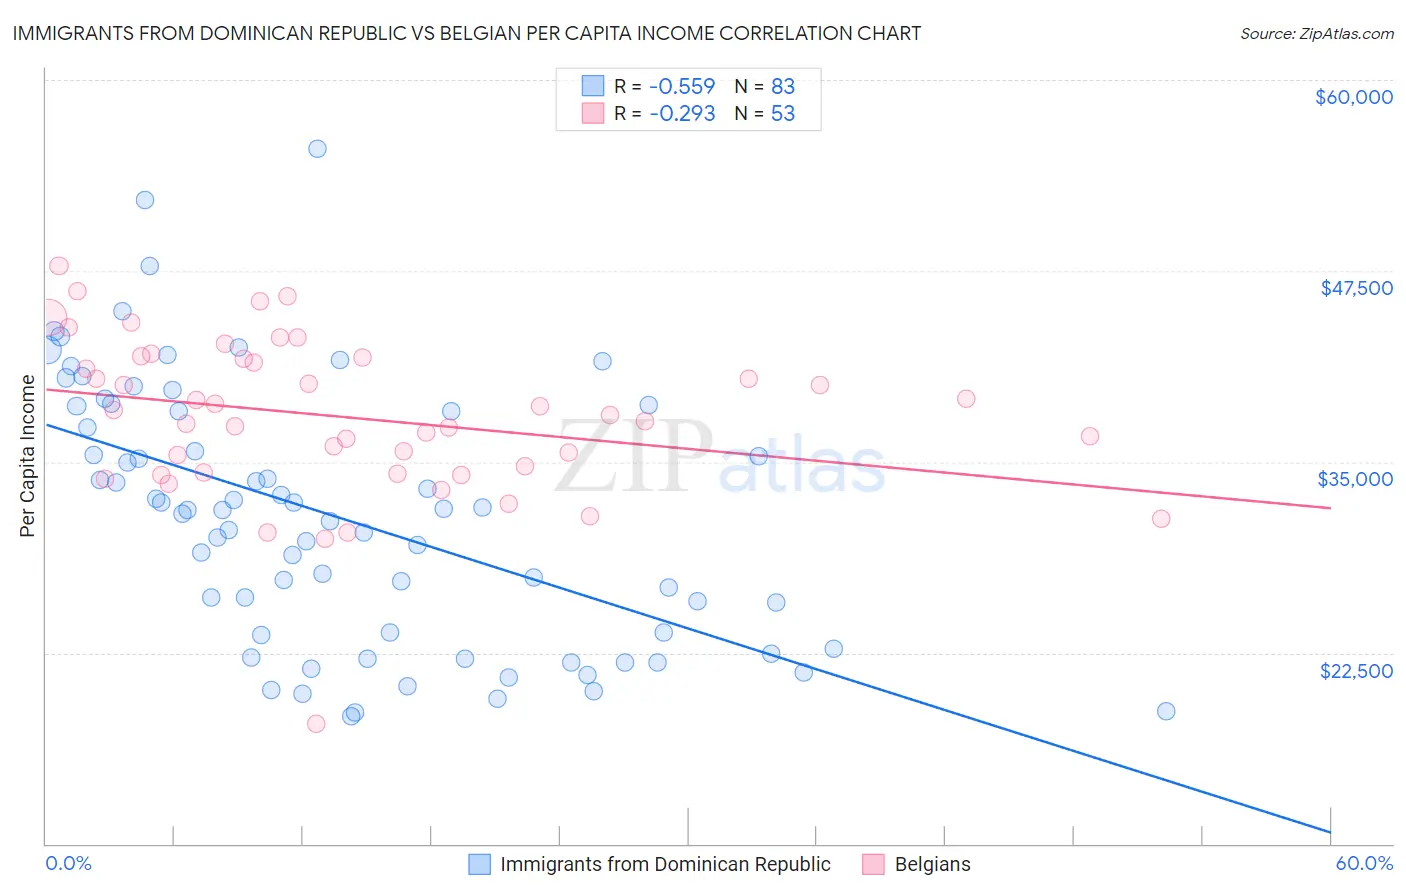
Immigrants from Dominican Republic vs Belgian Per Capita Income Correlation Chart
The statistical analysis conducted on geographies consisting of 275,145,161 people shows a substantial negative correlation between the proportion of Immigrants from Dominican Republic and per capita income in the United States with a correlation coefficient (R) of -0.559 and weighted average of $37,306. Similarly, the statistical analysis conducted on geographies consisting of 356,040,185 people shows a weak negative correlation between the proportion of Belgians and per capita income in the United States with a correlation coefficient (R) of -0.293 and weighted average of $43,951, a difference of 17.8%.
Per Capita Income Correlation Summary
| Measurement | Immigrants from Dominican Republic | Belgian |
| Minimum | $18,351 | $17,858 |
| Maximum | $55,513 | $47,841 |
| Range | $37,162 | $29,983 |
| Mean | $31,368 | $37,900 |
| Median | $31,841 | $38,096 |
| Interquartile 25% (IQ1) | $23,631 | $34,290 |
| Interquartile 75% (IQ3) | $38,333 | $41,814 |
| Interquartile Range (IQR) | $14,702 | $7,525 |
| Standard Deviation (Sample) | $8,445 | $5,270 |
| Standard Deviation (Population) | $8,394 | $5,220 |
Similar Demographics by Per Capita Income
Demographics Similar to Immigrants from Dominican Republic by Per Capita Income
In terms of per capita income, the demographic groups most similar to Immigrants from Dominican Republic are Indonesian ($37,300, a difference of 0.020%), Haitian ($37,289, a difference of 0.040%), Immigrants from Caribbean ($37,254, a difference of 0.14%), Cuban ($37,383, a difference of 0.21%), and Mexican American Indian ($37,407, a difference of 0.27%).
| Demographics | Rating | Rank | Per Capita Income |
| Blackfeet | 0.1 /100 | #288 | Tragic $37,695 |
| U.S. Virgin Islanders | 0.1 /100 | #289 | Tragic $37,589 |
| Immigrants | Guatemala | 0.1 /100 | #290 | Tragic $37,550 |
| Cajuns | 0.1 /100 | #291 | Tragic $37,527 |
| Immigrants | Micronesia | 0.1 /100 | #292 | Tragic $37,464 |
| Mexican American Indians | 0.1 /100 | #293 | Tragic $37,407 |
| Cubans | 0.1 /100 | #294 | Tragic $37,383 |
| Immigrants | Dominican Republic | 0.1 /100 | #295 | Tragic $37,306 |
| Indonesians | 0.1 /100 | #296 | Tragic $37,300 |
| Haitians | 0.1 /100 | #297 | Tragic $37,289 |
| Immigrants | Caribbean | 0.1 /100 | #298 | Tragic $37,254 |
| Cherokee | 0.1 /100 | #299 | Tragic $37,203 |
| Immigrants | Bahamas | 0.1 /100 | #300 | Tragic $37,193 |
| Ottawa | 0.1 /100 | #301 | Tragic $37,101 |
| Shoshone | 0.1 /100 | #302 | Tragic $37,072 |
Demographics Similar to Belgians by Per Capita Income
In terms of per capita income, the demographic groups most similar to Belgians are English ($43,982, a difference of 0.070%), Immigrants from Uruguay ($43,997, a difference of 0.10%), Immigrants from Philippines ($44,000, a difference of 0.11%), Sri Lankan ($44,014, a difference of 0.14%), and Immigrants from Peru ($43,852, a difference of 0.23%).
| Demographics | Rating | Rank | Per Capita Income |
| Costa Ricans | 61.8 /100 | #161 | Good $44,090 |
| Swiss | 61.4 /100 | #162 | Good $44,076 |
| Immigrants | South America | 61.2 /100 | #163 | Good $44,068 |
| Sri Lankans | 59.8 /100 | #164 | Average $44,014 |
| Immigrants | Philippines | 59.4 /100 | #165 | Average $44,000 |
| Immigrants | Uruguay | 59.3 /100 | #166 | Average $43,997 |
| English | 58.9 /100 | #167 | Average $43,982 |
| Belgians | 58.1 /100 | #168 | Average $43,951 |
| Immigrants | Peru | 55.3 /100 | #169 | Average $43,852 |
| Scandinavians | 55.2 /100 | #170 | Average $43,848 |
| Immigrants | Eastern Africa | 54.9 /100 | #171 | Average $43,838 |
| Czechoslovakians | 54.1 /100 | #172 | Average $43,806 |
| French | 50.7 /100 | #173 | Average $43,685 |
| Colombians | 50.0 /100 | #174 | Average $43,661 |
| Celtics | 48.9 /100 | #175 | Average $43,621 |