Immigrants from Dominican Republic vs Jamaican Per Capita Income
COMPARE
Immigrants from Dominican Republic
Jamaican
Per Capita Income
Per Capita Income Comparison
Immigrants from Dominican Republic
Jamaicans
$37,306
PER CAPITA INCOME
0.1/ 100
METRIC RATING
295th/ 347
METRIC RANK
$39,231
PER CAPITA INCOME
0.7/ 100
METRIC RATING
258th/ 347
METRIC RANK
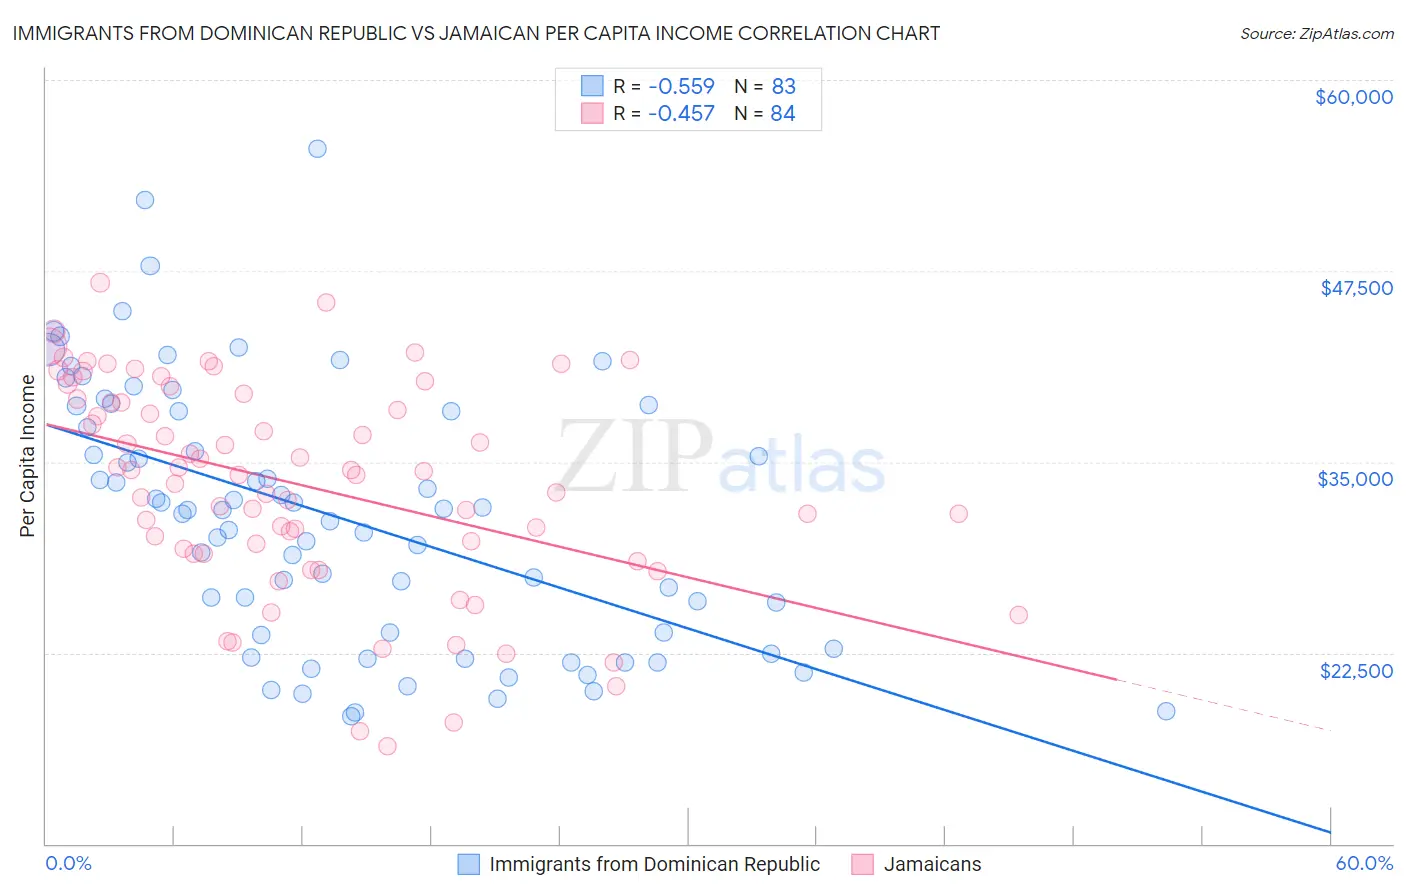
Immigrants from Dominican Republic vs Jamaican Per Capita Income Correlation Chart
The statistical analysis conducted on geographies consisting of 275,145,161 people shows a substantial negative correlation between the proportion of Immigrants from Dominican Republic and per capita income in the United States with a correlation coefficient (R) of -0.559 and weighted average of $37,306. Similarly, the statistical analysis conducted on geographies consisting of 368,110,686 people shows a moderate negative correlation between the proportion of Jamaicans and per capita income in the United States with a correlation coefficient (R) of -0.457 and weighted average of $39,231, a difference of 5.2%.
Per Capita Income Correlation Summary
| Measurement | Immigrants from Dominican Republic | Jamaican |
| Minimum | $18,351 | $16,350 |
| Maximum | $55,513 | $46,707 |
| Range | $37,162 | $30,357 |
| Mean | $31,368 | $33,502 |
| Median | $31,841 | $34,287 |
| Interquartile 25% (IQ1) | $23,631 | $29,169 |
| Interquartile 75% (IQ3) | $38,333 | $39,281 |
| Interquartile Range (IQR) | $14,702 | $10,112 |
| Standard Deviation (Sample) | $8,445 | $6,895 |
| Standard Deviation (Population) | $8,394 | $6,854 |
Similar Demographics by Per Capita Income
Demographics Similar to Immigrants from Dominican Republic by Per Capita Income
In terms of per capita income, the demographic groups most similar to Immigrants from Dominican Republic are Indonesian ($37,300, a difference of 0.020%), Haitian ($37,289, a difference of 0.040%), Immigrants from Caribbean ($37,254, a difference of 0.14%), Cuban ($37,383, a difference of 0.21%), and Mexican American Indian ($37,407, a difference of 0.27%).
| Demographics | Rating | Rank | Per Capita Income |
| Blackfeet | 0.1 /100 | #288 | Tragic $37,695 |
| U.S. Virgin Islanders | 0.1 /100 | #289 | Tragic $37,589 |
| Immigrants | Guatemala | 0.1 /100 | #290 | Tragic $37,550 |
| Cajuns | 0.1 /100 | #291 | Tragic $37,527 |
| Immigrants | Micronesia | 0.1 /100 | #292 | Tragic $37,464 |
| Mexican American Indians | 0.1 /100 | #293 | Tragic $37,407 |
| Cubans | 0.1 /100 | #294 | Tragic $37,383 |
| Immigrants | Dominican Republic | 0.1 /100 | #295 | Tragic $37,306 |
| Indonesians | 0.1 /100 | #296 | Tragic $37,300 |
| Haitians | 0.1 /100 | #297 | Tragic $37,289 |
| Immigrants | Caribbean | 0.1 /100 | #298 | Tragic $37,254 |
| Cherokee | 0.1 /100 | #299 | Tragic $37,203 |
| Immigrants | Bahamas | 0.1 /100 | #300 | Tragic $37,193 |
| Ottawa | 0.1 /100 | #301 | Tragic $37,101 |
| Shoshone | 0.1 /100 | #302 | Tragic $37,072 |
Demographics Similar to Jamaicans by Per Capita Income
In terms of per capita income, the demographic groups most similar to Jamaicans are Malaysian ($39,194, a difference of 0.090%), Alaskan Athabascan ($39,163, a difference of 0.17%), Marshallese ($39,108, a difference of 0.31%), Iroquois ($39,104, a difference of 0.33%), and Belizean ($39,097, a difference of 0.34%).
| Demographics | Rating | Rank | Per Capita Income |
| Samoans | 1.3 /100 | #251 | Tragic $39,826 |
| Immigrants | Azores | 1.0 /100 | #252 | Tragic $39,608 |
| Osage | 1.0 /100 | #253 | Tragic $39,568 |
| Alaska Natives | 1.0 /100 | #254 | Tragic $39,558 |
| Immigrants | Middle Africa | 1.0 /100 | #255 | Tragic $39,529 |
| Hawaiians | 0.8 /100 | #256 | Tragic $39,403 |
| Nicaraguans | 0.8 /100 | #257 | Tragic $39,372 |
| Jamaicans | 0.7 /100 | #258 | Tragic $39,231 |
| Malaysians | 0.7 /100 | #259 | Tragic $39,194 |
| Alaskan Athabascans | 0.6 /100 | #260 | Tragic $39,163 |
| Marshallese | 0.6 /100 | #261 | Tragic $39,108 |
| Iroquois | 0.6 /100 | #262 | Tragic $39,104 |
| Belizeans | 0.6 /100 | #263 | Tragic $39,097 |
| Americans | 0.6 /100 | #264 | Tragic $39,039 |
| Spanish Americans | 0.5 /100 | #265 | Tragic $39,012 |