Immigrants from Dominican Republic vs Immigrants from Central America Per Capita Income
COMPARE
Immigrants from Dominican Republic
Immigrants from Central America
Per Capita Income
Per Capita Income Comparison
Immigrants from Dominican Republic
Immigrants from Central America
$37,306
PER CAPITA INCOME
0.1/ 100
METRIC RATING
295th/ 347
METRIC RANK
$34,974
PER CAPITA INCOME
0.0/ 100
METRIC RATING
325th/ 347
METRIC RANK
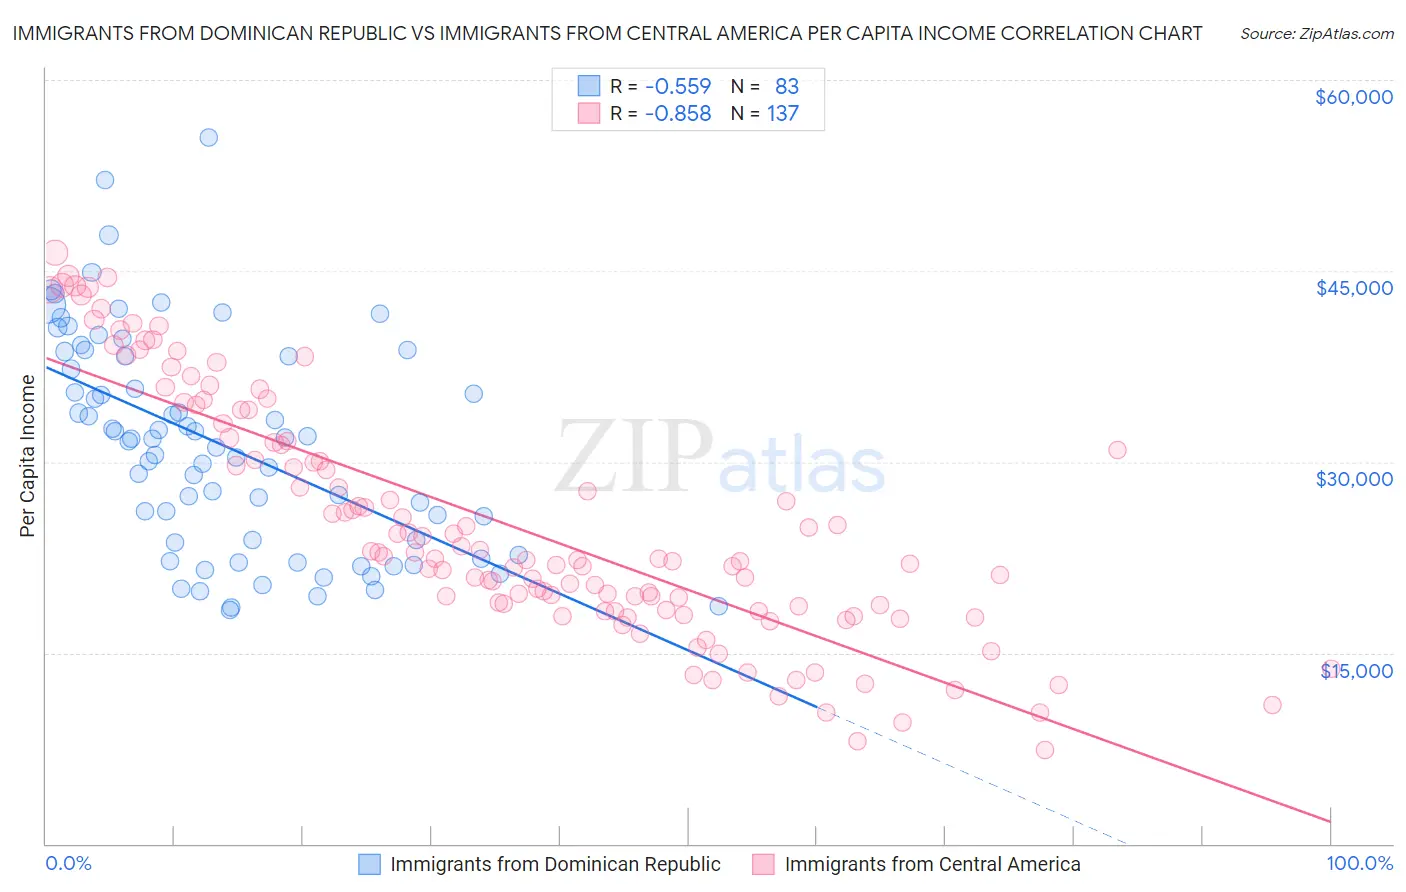
Immigrants from Dominican Republic vs Immigrants from Central America Per Capita Income Correlation Chart
The statistical analysis conducted on geographies consisting of 275,145,161 people shows a substantial negative correlation between the proportion of Immigrants from Dominican Republic and per capita income in the United States with a correlation coefficient (R) of -0.559 and weighted average of $37,306. Similarly, the statistical analysis conducted on geographies consisting of 536,571,616 people shows a very strong negative correlation between the proportion of Immigrants from Central America and per capita income in the United States with a correlation coefficient (R) of -0.858 and weighted average of $34,974, a difference of 6.7%.
Per Capita Income Correlation Summary
| Measurement | Immigrants from Dominican Republic | Immigrants from Central America |
| Minimum | $18,351 | $7,365 |
| Maximum | $55,513 | $46,418 |
| Range | $37,162 | $39,053 |
| Mean | $31,368 | $25,175 |
| Median | $31,841 | $22,366 |
| Interquartile 25% (IQ1) | $23,631 | $18,495 |
| Interquartile 75% (IQ3) | $38,333 | $31,763 |
| Interquartile Range (IQR) | $14,702 | $13,268 |
| Standard Deviation (Sample) | $8,445 | $9,475 |
| Standard Deviation (Population) | $8,394 | $9,440 |
Similar Demographics by Per Capita Income
Demographics Similar to Immigrants from Dominican Republic by Per Capita Income
In terms of per capita income, the demographic groups most similar to Immigrants from Dominican Republic are Indonesian ($37,300, a difference of 0.020%), Haitian ($37,289, a difference of 0.040%), Immigrants from Caribbean ($37,254, a difference of 0.14%), Cuban ($37,383, a difference of 0.21%), and Mexican American Indian ($37,407, a difference of 0.27%).
| Demographics | Rating | Rank | Per Capita Income |
| Blackfeet | 0.1 /100 | #288 | Tragic $37,695 |
| U.S. Virgin Islanders | 0.1 /100 | #289 | Tragic $37,589 |
| Immigrants | Guatemala | 0.1 /100 | #290 | Tragic $37,550 |
| Cajuns | 0.1 /100 | #291 | Tragic $37,527 |
| Immigrants | Micronesia | 0.1 /100 | #292 | Tragic $37,464 |
| Mexican American Indians | 0.1 /100 | #293 | Tragic $37,407 |
| Cubans | 0.1 /100 | #294 | Tragic $37,383 |
| Immigrants | Dominican Republic | 0.1 /100 | #295 | Tragic $37,306 |
| Indonesians | 0.1 /100 | #296 | Tragic $37,300 |
| Haitians | 0.1 /100 | #297 | Tragic $37,289 |
| Immigrants | Caribbean | 0.1 /100 | #298 | Tragic $37,254 |
| Cherokee | 0.1 /100 | #299 | Tragic $37,203 |
| Immigrants | Bahamas | 0.1 /100 | #300 | Tragic $37,193 |
| Ottawa | 0.1 /100 | #301 | Tragic $37,101 |
| Shoshone | 0.1 /100 | #302 | Tragic $37,072 |
Demographics Similar to Immigrants from Central America by Per Capita Income
In terms of per capita income, the demographic groups most similar to Immigrants from Central America are Immigrants from Cuba ($34,910, a difference of 0.18%), Apache ($34,886, a difference of 0.25%), Kiowa ($35,102, a difference of 0.37%), Cheyenne ($35,276, a difference of 0.87%), and Menominee ($34,578, a difference of 1.1%).
| Demographics | Rating | Rank | Per Capita Income |
| Bangladeshis | 0.0 /100 | #318 | Tragic $35,897 |
| Immigrants | Congo | 0.0 /100 | #319 | Tragic $35,720 |
| Hispanics or Latinos | 0.0 /100 | #320 | Tragic $35,688 |
| Blacks/African Americans | 0.0 /100 | #321 | Tragic $35,564 |
| Creek | 0.0 /100 | #322 | Tragic $35,546 |
| Cheyenne | 0.0 /100 | #323 | Tragic $35,276 |
| Kiowa | 0.0 /100 | #324 | Tragic $35,102 |
| Immigrants | Central America | 0.0 /100 | #325 | Tragic $34,974 |
| Immigrants | Cuba | 0.0 /100 | #326 | Tragic $34,910 |
| Apache | 0.0 /100 | #327 | Tragic $34,886 |
| Menominee | 0.0 /100 | #328 | Tragic $34,578 |
| Mexicans | 0.0 /100 | #329 | Tragic $34,559 |
| Spanish American Indians | 0.0 /100 | #330 | Tragic $34,195 |
| Immigrants | Mexico | 0.0 /100 | #331 | Tragic $33,931 |
| Sioux | 0.0 /100 | #332 | Tragic $33,921 |