Immigrants from Dominican Republic vs Immigrants from Asia Per Capita Income
COMPARE
Immigrants from Dominican Republic
Immigrants from Asia
Per Capita Income
Per Capita Income Comparison
Immigrants from Dominican Republic
Immigrants from Asia
$37,306
PER CAPITA INCOME
0.1/ 100
METRIC RATING
295th/ 347
METRIC RANK
$49,741
PER CAPITA INCOME
99.9/ 100
METRIC RATING
62nd/ 347
METRIC RANK
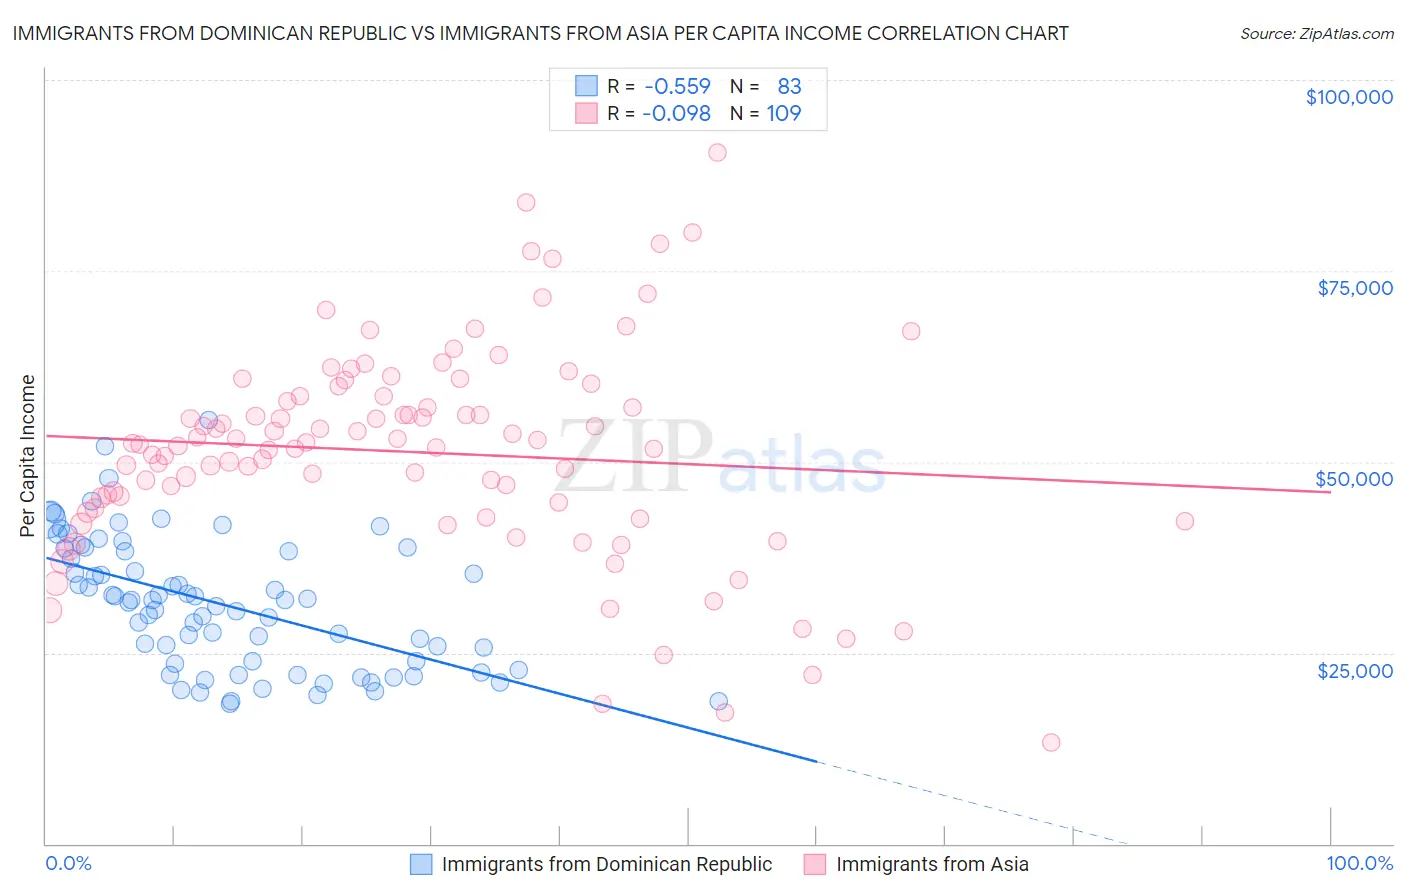
Immigrants from Dominican Republic vs Immigrants from Asia Per Capita Income Correlation Chart
The statistical analysis conducted on geographies consisting of 275,145,161 people shows a substantial negative correlation between the proportion of Immigrants from Dominican Republic and per capita income in the United States with a correlation coefficient (R) of -0.559 and weighted average of $37,306. Similarly, the statistical analysis conducted on geographies consisting of 549,218,317 people shows a slight negative correlation between the proportion of Immigrants from Asia and per capita income in the United States with a correlation coefficient (R) of -0.098 and weighted average of $49,741, a difference of 33.3%.
Per Capita Income Correlation Summary
| Measurement | Immigrants from Dominican Republic | Immigrants from Asia |
| Minimum | $18,351 | $13,219 |
| Maximum | $55,513 | $90,491 |
| Range | $37,162 | $77,273 |
| Mean | $31,368 | $51,284 |
| Median | $31,841 | $52,258 |
| Interquartile 25% (IQ1) | $23,631 | $43,660 |
| Interquartile 75% (IQ3) | $38,333 | $58,564 |
| Interquartile Range (IQR) | $14,702 | $14,904 |
| Standard Deviation (Sample) | $8,445 | $13,798 |
| Standard Deviation (Population) | $8,394 | $13,734 |
Similar Demographics by Per Capita Income
Demographics Similar to Immigrants from Dominican Republic by Per Capita Income
In terms of per capita income, the demographic groups most similar to Immigrants from Dominican Republic are Indonesian ($37,300, a difference of 0.020%), Haitian ($37,289, a difference of 0.040%), Immigrants from Caribbean ($37,254, a difference of 0.14%), Cuban ($37,383, a difference of 0.21%), and Mexican American Indian ($37,407, a difference of 0.27%).
| Demographics | Rating | Rank | Per Capita Income |
| Blackfeet | 0.1 /100 | #288 | Tragic $37,695 |
| U.S. Virgin Islanders | 0.1 /100 | #289 | Tragic $37,589 |
| Immigrants | Guatemala | 0.1 /100 | #290 | Tragic $37,550 |
| Cajuns | 0.1 /100 | #291 | Tragic $37,527 |
| Immigrants | Micronesia | 0.1 /100 | #292 | Tragic $37,464 |
| Mexican American Indians | 0.1 /100 | #293 | Tragic $37,407 |
| Cubans | 0.1 /100 | #294 | Tragic $37,383 |
| Immigrants | Dominican Republic | 0.1 /100 | #295 | Tragic $37,306 |
| Indonesians | 0.1 /100 | #296 | Tragic $37,300 |
| Haitians | 0.1 /100 | #297 | Tragic $37,289 |
| Immigrants | Caribbean | 0.1 /100 | #298 | Tragic $37,254 |
| Cherokee | 0.1 /100 | #299 | Tragic $37,203 |
| Immigrants | Bahamas | 0.1 /100 | #300 | Tragic $37,193 |
| Ottawa | 0.1 /100 | #301 | Tragic $37,101 |
| Shoshone | 0.1 /100 | #302 | Tragic $37,072 |
Demographics Similar to Immigrants from Asia by Per Capita Income
In terms of per capita income, the demographic groups most similar to Immigrants from Asia are Maltese ($49,640, a difference of 0.20%), Immigrants from Argentina ($49,627, a difference of 0.23%), Argentinean ($49,862, a difference of 0.24%), Bhutanese ($49,894, a difference of 0.31%), and Immigrants from Scotland ($49,893, a difference of 0.31%).
| Demographics | Rating | Rank | Per Capita Income |
| Immigrants | Western Europe | 99.9 /100 | #55 | Exceptional $50,065 |
| Asians | 99.9 /100 | #56 | Exceptional $50,057 |
| South Africans | 99.9 /100 | #57 | Exceptional $50,044 |
| Immigrants | Malaysia | 99.9 /100 | #58 | Exceptional $49,983 |
| Bhutanese | 99.9 /100 | #59 | Exceptional $49,894 |
| Immigrants | Scotland | 99.9 /100 | #60 | Exceptional $49,893 |
| Argentineans | 99.9 /100 | #61 | Exceptional $49,862 |
| Immigrants | Asia | 99.9 /100 | #62 | Exceptional $49,741 |
| Maltese | 99.9 /100 | #63 | Exceptional $49,640 |
| Immigrants | Argentina | 99.9 /100 | #64 | Exceptional $49,627 |
| Bolivians | 99.9 /100 | #65 | Exceptional $49,526 |
| Immigrants | Bulgaria | 99.9 /100 | #66 | Exceptional $49,482 |
| Immigrants | Romania | 99.9 /100 | #67 | Exceptional $49,463 |
| Lithuanians | 99.8 /100 | #68 | Exceptional $49,448 |
| Immigrants | Canada | 99.8 /100 | #69 | Exceptional $49,412 |