Estonian vs Immigrants from Sri Lanka Median Earnings

COMPARE

Estonian
Race
Ancestry
AfghanAfricanAlaska NativeAlaskan AthabascanAlbanianAleutAlsatianAmericanApacheArabArapahoArgentineanArmenianAssyrian/Chaldean/SyriacAustralianAustrianBahamianBangladeshiBarbadianBasqueBelgianBelizeanBermudanBhutaneseBlackfeetBolivianBrazilianBritishBritish West IndianBulgarianBurmeseCajunCambodianCanadianCape VerdeanCarpatho RusynCelticCentral AmericanCentral American IndianCherokeeCheyenneChickasawChileanChineseChippewaChoctawColombianColvilleComancheCosta RicanCreeCreekCroatianCrowCubanCypriotCzechCzechoslovakianDanishDelawareDominicanDutchDutch West IndianEastern EuropeanEcuadorianEgyptianEnglishEstonianEthiopianEuropeanFijianFilipinoFinnishFrenchFrench American IndianFrench CanadianGermanGerman RussianGhanaianGreekGuamanian/ChamorroGuatemalanGuyaneseHaitianHmongHonduranHopiHoumaHungarianIcelanderIndian (Asian)IndonesianInupiatIranianIraqiIrishIroquoisIsraeliItalianJamaicanJapaneseJordanianKenyanKiowaKoreanLaotianLatvianLebaneseLiberianLithuanianLumbeeLuxembourgerMacedonianMalaysianMalteseMarshalleseMenomineeMexicanMexican American IndianMongolianMoroccanNative HawaiianNavajoNepaleseNew ZealanderNicaraguanNigerianNorthern EuropeanNorwegianOkinawanOsageOttawaPaiutePakistaniPalestinianPanamanianParaguayanPennsylvania GermanPeruvianPimaPolishPortuguesePotawatomiPuebloPuerto RicanPuget Sound SalishRomanianRussianSalvadoranSamoanScandinavianScotch-IrishScottishSeminoleSenegaleseSerbianShoshoneSierra LeoneanSiouxSlavicSlovakSloveneSomaliSouth AfricanSouth AmericanSouth American IndianSoviet UnionSpaniardSpanishSpanish AmericanSpanish American IndianSri LankanSubsaharan AfricanSudaneseSwedishSwissSyrianTaiwaneseThaiTlingit-HaidaTohono O'OdhamTonganTrinidadian and TobagonianTsimshianTurkishU.S. Virgin IslanderUgandanUkrainianUruguayanUteVenezuelanVietnameseWelshWest IndianYakamaYaquiYugoslavianYumanYup'ikZimbabwean
Immigration
NonimmigrantsImmigrantsAfghanistanAfricaAlbaniaArgentinaArmeniaAsiaAustraliaAustriaBahamasBangladeshBarbadosBelarusBelgiumBelizeBoliviaBosnia and HerzegovinaBrazilBulgariaBurma/MyanmarCabo VerdeCambodiaCameroonCanadaCaribbeanCentral AmericaChileChinaColombiaCongoCosta RicaCroatiaCubaCzechoslovakiaDenmarkDominicaDominican RepublicEastern AfricaEastern AsiaEastern EuropeEcuadorEgyptEl SalvadorEnglandEritreaEthiopiaEuropeFijiFranceGermanyGhanaGreeceGrenadaGuatemalaGuyanaHaitiHondurasHong KongHungaryIndiaIndonesiaIranIraqIrelandIsraelItalyJamaicaJapanJordanKazakhstanKenyaKoreaKuwaitLaosLatin AmericaLatviaLebanonLiberiaLithuaniaMalaysiaMexicoMicronesiaMiddle AfricaMoldovaMoroccoNepalNetherlandsNicaraguaNigeriaNorth AmericaNorth MacedoniaNorthern AfricaNorthern EuropeNorwayOceaniaPakistanPanamaPeruPhilippinesPolandPortugalRomaniaRussiaSaudi ArabiaScotlandSenegalSerbiaSierra LeoneSingaporeSomaliaSouth AfricaSouth AmericaSouth Central AsiaSouth Eastern AsiaSouthern EuropeSpainSt. Vincent and the GrenadinesSudanSwedenSwitzerlandSyriaTaiwanThailandTrinidad and TobagoTurkeyUgandaUkraineUruguayUzbekistanVenezuelaVietnamWest IndiesWestern AfricaWestern AsiaWestern EuropeYemenZaireZimbabweAzores
Immigrants from Sri Lanka
Race
Ancestry
AfghanAfricanAlaska NativeAlaskan AthabascanAlbanianAleutAlsatianAmericanApacheArabArapahoArgentineanArmenianAssyrian/Chaldean/SyriacAustralianAustrianBahamianBangladeshiBarbadianBasqueBelgianBelizeanBermudanBhutaneseBlackfeetBolivianBrazilianBritishBritish West IndianBulgarianBurmeseCajunCambodianCanadianCape VerdeanCarpatho RusynCelticCentral AmericanCentral American IndianCherokeeCheyenneChickasawChileanChineseChippewaChoctawColombianColvilleComancheCosta RicanCreeCreekCroatianCrowCubanCypriotCzechCzechoslovakianDanishDelawareDominicanDutchDutch West IndianEastern EuropeanEcuadorianEgyptianEnglishEthiopianEuropeanFijianFilipinoFinnishFrenchFrench American IndianFrench CanadianGermanGerman RussianGhanaianGreekGuamanian/ChamorroGuatemalanGuyaneseHaitianHmongHonduranHopiHoumaHungarianIcelanderIndian (Asian)IndonesianInupiatIranianIraqiIrishIroquoisIsraeliItalianJamaicanJapaneseJordanianKenyanKiowaKoreanLaotianLatvianLebaneseLiberianLithuanianLumbeeLuxembourgerMacedonianMalaysianMalteseMarshalleseMenomineeMexicanMexican American IndianMongolianMoroccanNative HawaiianNavajoNepaleseNew ZealanderNicaraguanNigerianNorthern EuropeanNorwegianOkinawanOsageOttawaPaiutePakistaniPalestinianPanamanianParaguayanPennsylvania GermanPeruvianPimaPolishPortuguesePotawatomiPuebloPuerto RicanPuget Sound SalishRomanianRussianSalvadoranSamoanScandinavianScotch-IrishScottishSeminoleSenegaleseSerbianShoshoneSierra LeoneanSiouxSlavicSlovakSloveneSomaliSouth AfricanSouth AmericanSouth American IndianSoviet UnionSpaniardSpanishSpanish AmericanSpanish American IndianSri LankanSubsaharan AfricanSudaneseSwedishSwissSyrianTaiwaneseThaiTlingit-HaidaTohono O'OdhamTonganTrinidadian and TobagonianTsimshianTurkishU.S. Virgin IslanderUgandanUkrainianUruguayanUteVenezuelanVietnameseWelshWest IndianYakamaYaquiYugoslavianYumanYup'ikZimbabwean
Immigration
NonimmigrantsImmigrantsAfghanistanAfricaAlbaniaArgentinaArmeniaAsiaAustraliaAustriaBahamasBangladeshBarbadosBelarusBelgiumBelizeBoliviaBosnia and HerzegovinaBrazilBulgariaBurma/MyanmarCabo VerdeCambodiaCameroonCanadaCaribbeanCentral AmericaChileChinaColombiaCongoCosta RicaCroatiaCubaCzechoslovakiaDenmarkDominicaDominican RepublicEastern AfricaEastern AsiaEastern EuropeEcuadorEgyptEl SalvadorEnglandEritreaEthiopiaEuropeFijiFranceGermanyGhanaGreeceGrenadaGuatemalaGuyanaHaitiHondurasHong KongHungaryIndiaIndonesiaIranIraqIrelandIsraelItalyJamaicaJapanJordanKazakhstanKenyaKoreaKuwaitLaosLatin AmericaLatviaLebanonLiberiaLithuaniaMalaysiaMexicoMicronesiaMiddle AfricaMoldovaMoroccoNepalNetherlandsNicaraguaNigeriaNorth AmericaNorth MacedoniaNorthern AfricaNorthern EuropeNorwayOceaniaPakistanPanamaPeruPhilippinesPolandPortugalRomaniaRussiaSaudi ArabiaScotlandSenegalSerbiaSierra LeoneSingaporeSomaliaSouth AfricaSouth AmericaSouth Central AsiaSouth Eastern AsiaSouthern EuropeSpainSri LankaSt. Vincent and the GrenadinesSudanSwedenSwitzerlandSyriaTaiwanThailandTrinidad and TobagoTurkeyUgandaUkraineUruguayUzbekistanVenezuelaVietnamWest IndiesWestern AfricaWestern AsiaWestern EuropeYemenZaireZimbabweAzores
Median Earnings
Income
Poverty
Unemployment
Labor Participation
Family Structure
Vehicle Availability
Education Level
Disability

Median Earnings Comparison

Estonians

Immigrants from Sri Lanka

Exceptional
Exceptional
$51,772
MEDIAN EARNINGS
99.9/ 100
METRIC RATING
52nd/ 347
METRIC RANK
$53,268
MEDIAN EARNINGS
100.0/ 100
METRIC RATING
34th/ 347
METRIC RANK

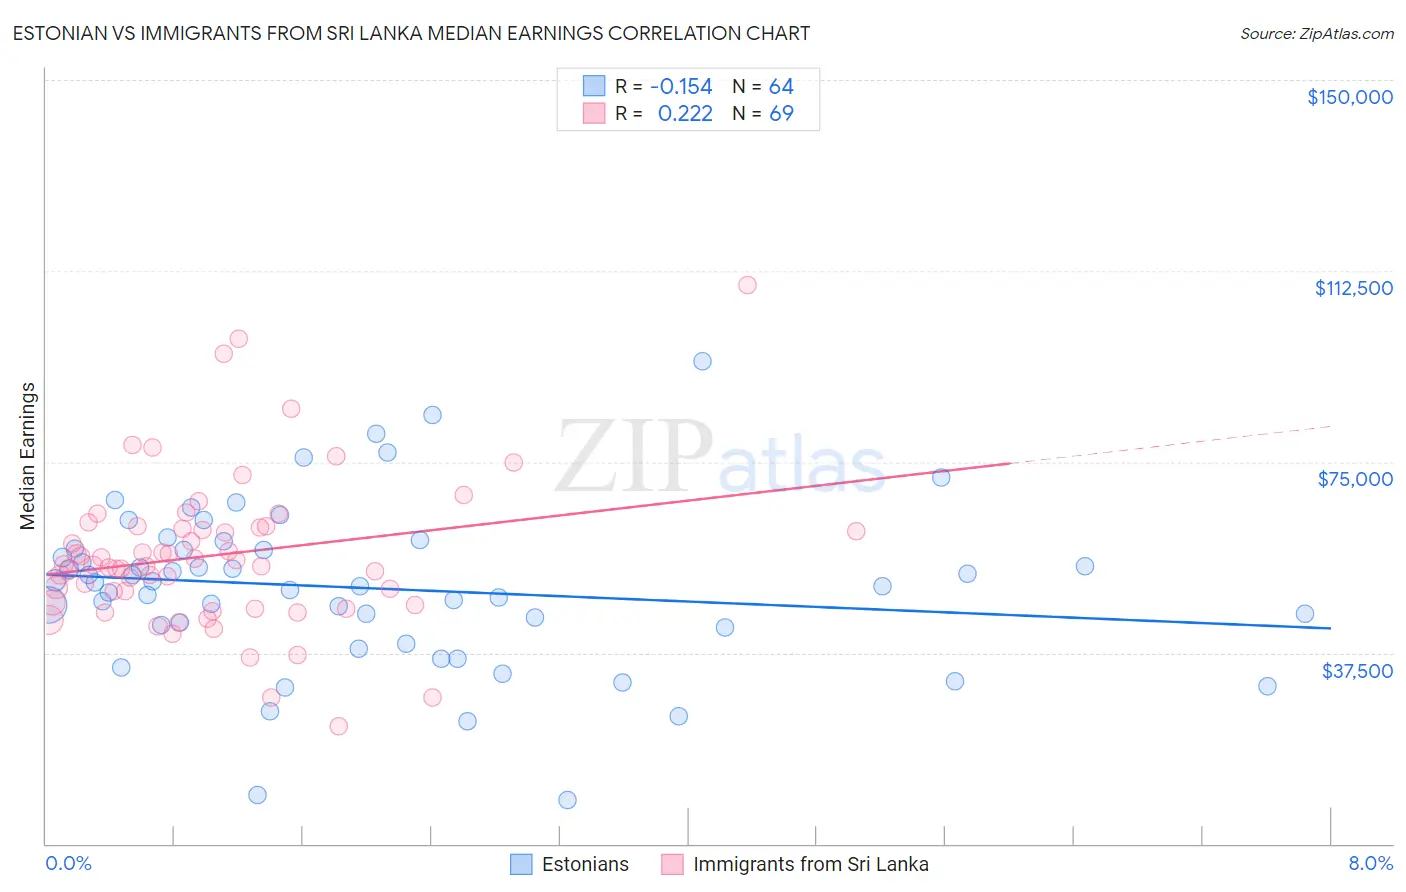
Estonian vs Immigrants from Sri Lanka Median Earnings Correlation Chart

The statistical analysis conducted on geographies consisting of 123,525,631 people shows a poor negative correlation between the proportion of Estonians and median earnings in the United States with a correlation coefficient (R) of -0.154 and weighted average of $51,772. Similarly, the statistical analysis conducted on geographies consisting of 149,698,351 people shows a weak positive correlation between the proportion of Immigrants from Sri Lanka and median earnings in the United States with a correlation coefficient (R) of 0.222 and weighted average of $53,268, a difference of 2.9%.
Estonian vs Immigrants from Sri Lanka Median Earnings

Median Earnings Correlation Summary

MeasurementEstonianImmigrants from Sri Lanka
Minimum$8,672$23,025
Maximum$94,792$109,620
Range$86,120$86,595
Mean$50,194$56,667
Median$50,958$54,686
Interquartile 25% (IQ1)$42,740$47,118
Interquartile 75% (IQ3)$57,865$62,136
Interquartile Range (IQR)$15,125$15,018
Standard Deviation (Sample)$15,990$15,005
Standard Deviation (Population)$15,865$14,895

Demographics Similar to Estonians and Immigrants from Sri Lanka by Median Earnings

In terms of median earnings, the demographic groups most similar to Estonians are Immigrants from Norway ($51,758, a difference of 0.030%), Immigrants from Austria ($51,826, a difference of 0.10%), Immigrants from South Africa ($51,850, a difference of 0.15%), Bolivian ($52,005, a difference of 0.45%), and Immigrants from Europe ($52,195, a difference of 0.82%). Similarly, the demographic groups most similar to Immigrants from Sri Lanka are Immigrants from Greece ($53,282, a difference of 0.030%), Immigrants from Switzerland ($53,211, a difference of 0.11%), Immigrants from Denmark ($53,186, a difference of 0.15%), Immigrants from Belarus ($53,043, a difference of 0.42%), and Latvian ($53,001, a difference of 0.50%).
DemographicsRating | RankMedian Earnings
Immigrants | Greece
100.0
/100
|
#33
Exceptional
$53,282
Immigrants | Sri Lanka
100.0
/100
|
#34
Exceptional
$53,268
Immigrants | Switzerland
100.0
/100
|
#35
Exceptional
$53,211
Immigrants | Denmark
100.0
/100
|
#36
Exceptional
$53,186
Immigrants | Belarus
100.0
/100
|
#37
Exceptional
$53,043
Latvians
100.0
/100
|
#38
Exceptional
$53,001
Immigrants | Turkey
100.0
/100
|
#39
Exceptional
$52,960
Israelis
100.0
/100
|
#40
Exceptional
$52,937
Immigrants | Lithuania
100.0
/100
|
#41
Exceptional
$52,769
Maltese
100.0
/100
|
#42
Exceptional
$52,526
Immigrants | Malaysia
100.0
/100
|
#43
Exceptional
$52,514
Bulgarians
100.0
/100
|
#44
Exceptional
$52,512
Immigrants | Czechoslovakia
100.0
/100
|
#45
Exceptional
$52,361
Bhutanese
100.0
/100
|
#46
Exceptional
$52,297
Australians
100.0
/100
|
#47
Exceptional
$52,294
Immigrants | Europe
100.0
/100
|
#48
Exceptional
$52,195
Bolivians
100.0
/100
|
#49
Exceptional
$52,005
Immigrants | South Africa
100.0
/100
|
#50
Exceptional
$51,850
Immigrants | Austria
99.9
/100
|
#51
Exceptional
$51,826
Estonians
99.9
/100
|
#52
Exceptional
$51,772
Immigrants | Norway
99.9
/100
|
#53
Exceptional
$51,758