Immigrants from Costa Rica vs Immigrants from Sri Lanka Median Earnings
COMPARE
Immigrants from Costa Rica
Immigrants from Sri Lanka
Median Earnings
Median Earnings Comparison
Immigrants from Costa Rica
Immigrants from Sri Lanka
$45,928
MEDIAN EARNINGS
33.0/ 100
METRIC RATING
194th/ 347
METRIC RANK
$53,268
MEDIAN EARNINGS
100.0/ 100
METRIC RATING
34th/ 347
METRIC RANK
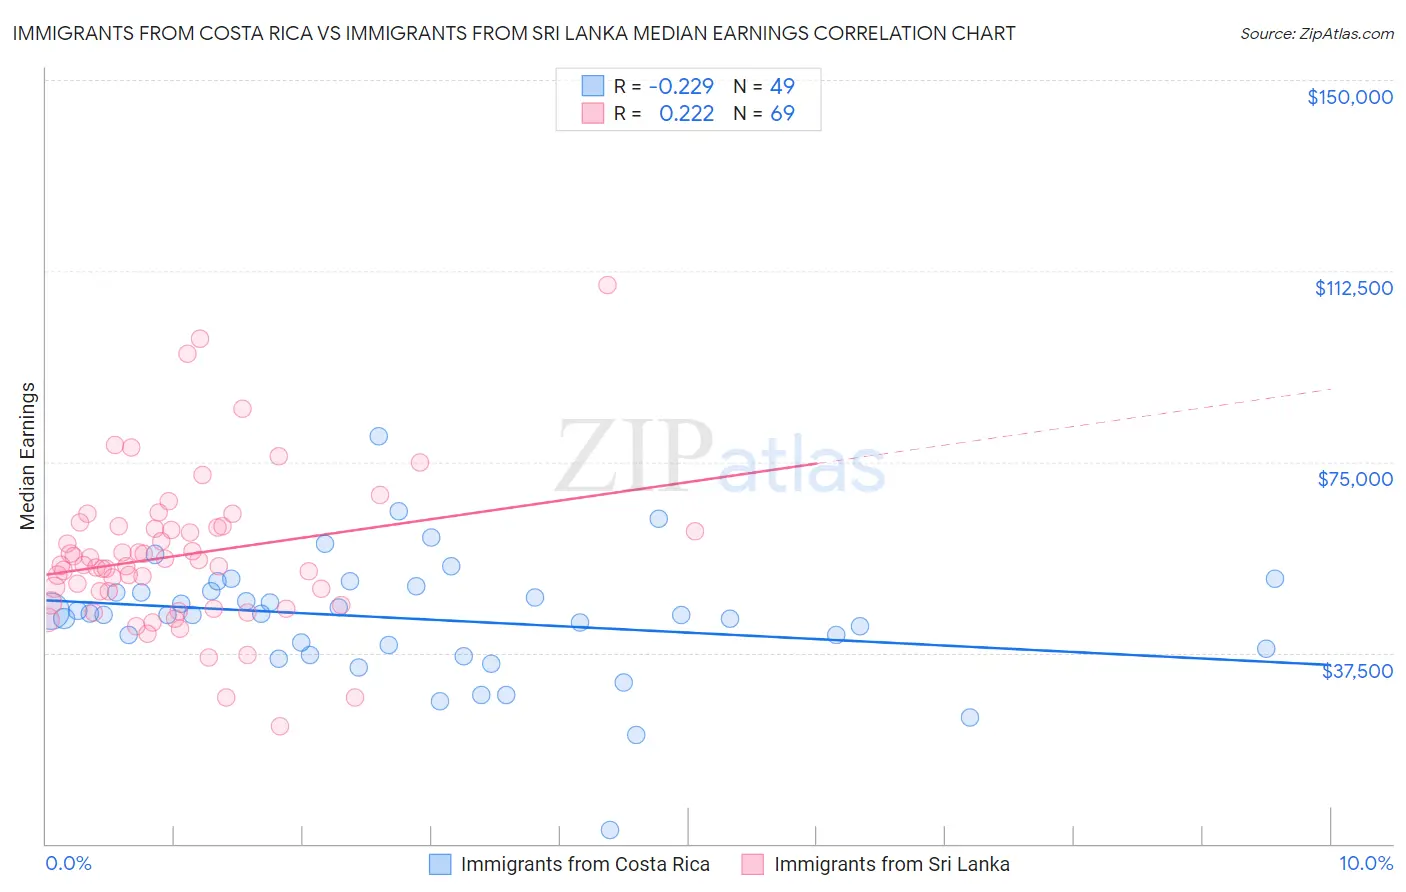
Immigrants from Costa Rica vs Immigrants from Sri Lanka Median Earnings Correlation Chart
The statistical analysis conducted on geographies consisting of 204,262,782 people shows a weak negative correlation between the proportion of Immigrants from Costa Rica and median earnings in the United States with a correlation coefficient (R) of -0.229 and weighted average of $45,928. Similarly, the statistical analysis conducted on geographies consisting of 149,698,351 people shows a weak positive correlation between the proportion of Immigrants from Sri Lanka and median earnings in the United States with a correlation coefficient (R) of 0.222 and weighted average of $53,268, a difference of 16.0%.
Median Earnings Correlation Summary
| Measurement | Immigrants from Costa Rica | Immigrants from Sri Lanka |
| Minimum | $2,615 | $23,025 |
| Maximum | $80,083 | $109,620 |
| Range | $77,468 | $86,595 |
| Mean | $44,180 | $56,667 |
| Median | $45,027 | $54,686 |
| Interquartile 25% (IQ1) | $37,709 | $47,118 |
| Interquartile 75% (IQ3) | $50,100 | $62,136 |
| Interquartile Range (IQR) | $12,390 | $15,018 |
| Standard Deviation (Sample) | $12,240 | $15,005 |
| Standard Deviation (Population) | $12,114 | $14,895 |
Similar Demographics by Median Earnings
Demographics Similar to Immigrants from Costa Rica by Median Earnings
In terms of median earnings, the demographic groups most similar to Immigrants from Costa Rica are Guamanian/Chamorro ($45,933, a difference of 0.010%), German ($45,935, a difference of 0.020%), Finnish ($45,940, a difference of 0.030%), Immigrants from St. Vincent and the Grenadines ($45,908, a difference of 0.040%), and Yugoslavian ($45,846, a difference of 0.18%).
| Demographics | Rating | Rank | Median Earnings |
| Iraqis | 39.9 /100 | #187 | Fair $46,140 |
| Immigrants | Armenia | 38.3 /100 | #188 | Fair $46,094 |
| Spaniards | 37.2 /100 | #189 | Fair $46,059 |
| French Canadians | 36.1 /100 | #190 | Fair $46,026 |
| Finns | 33.4 /100 | #191 | Fair $45,940 |
| Germans | 33.2 /100 | #192 | Fair $45,935 |
| Guamanians/Chamorros | 33.2 /100 | #193 | Fair $45,933 |
| Immigrants | Costa Rica | 33.0 /100 | #194 | Fair $45,928 |
| Immigrants | St. Vincent and the Grenadines | 32.4 /100 | #195 | Fair $45,908 |
| Yugoslavians | 30.5 /100 | #196 | Fair $45,846 |
| Barbadians | 30.5 /100 | #197 | Fair $45,846 |
| Trinidadians and Tobagonians | 29.7 /100 | #198 | Fair $45,820 |
| Immigrants | Barbados | 29.6 /100 | #199 | Fair $45,816 |
| Immigrants | Azores | 29.5 /100 | #200 | Fair $45,812 |
| Celtics | 27.2 /100 | #201 | Fair $45,732 |
Demographics Similar to Immigrants from Sri Lanka by Median Earnings
In terms of median earnings, the demographic groups most similar to Immigrants from Sri Lanka are Immigrants from Greece ($53,282, a difference of 0.030%), Immigrants from Asia ($53,310, a difference of 0.080%), Immigrants from Switzerland ($53,211, a difference of 0.11%), Russian ($53,334, a difference of 0.12%), and Immigrants from Denmark ($53,186, a difference of 0.15%).
| Demographics | Rating | Rank | Median Earnings |
| Asians | 100.0 /100 | #27 | Exceptional $53,690 |
| Immigrants | France | 100.0 /100 | #28 | Exceptional $53,490 |
| Immigrants | Russia | 100.0 /100 | #29 | Exceptional $53,457 |
| Cambodians | 100.0 /100 | #30 | Exceptional $53,386 |
| Russians | 100.0 /100 | #31 | Exceptional $53,334 |
| Immigrants | Asia | 100.0 /100 | #32 | Exceptional $53,310 |
| Immigrants | Greece | 100.0 /100 | #33 | Exceptional $53,282 |
| Immigrants | Sri Lanka | 100.0 /100 | #34 | Exceptional $53,268 |
| Immigrants | Switzerland | 100.0 /100 | #35 | Exceptional $53,211 |
| Immigrants | Denmark | 100.0 /100 | #36 | Exceptional $53,186 |
| Immigrants | Belarus | 100.0 /100 | #37 | Exceptional $53,043 |
| Latvians | 100.0 /100 | #38 | Exceptional $53,001 |
| Immigrants | Turkey | 100.0 /100 | #39 | Exceptional $52,960 |
| Israelis | 100.0 /100 | #40 | Exceptional $52,937 |
| Immigrants | Lithuania | 100.0 /100 | #41 | Exceptional $52,769 |