Immigrants from Central America vs French Canadian Median Household Income
COMPARE
Immigrants from Central America
French Canadian
Median Household Income
Median Household Income Comparison
Immigrants from Central America
French Canadians
$74,217
MEDIAN HOUSEHOLD INCOME
0.1/ 100
METRIC RATING
288th/ 347
METRIC RANK
$82,810
MEDIAN HOUSEHOLD INCOME
18.7/ 100
METRIC RATING
208th/ 347
METRIC RANK
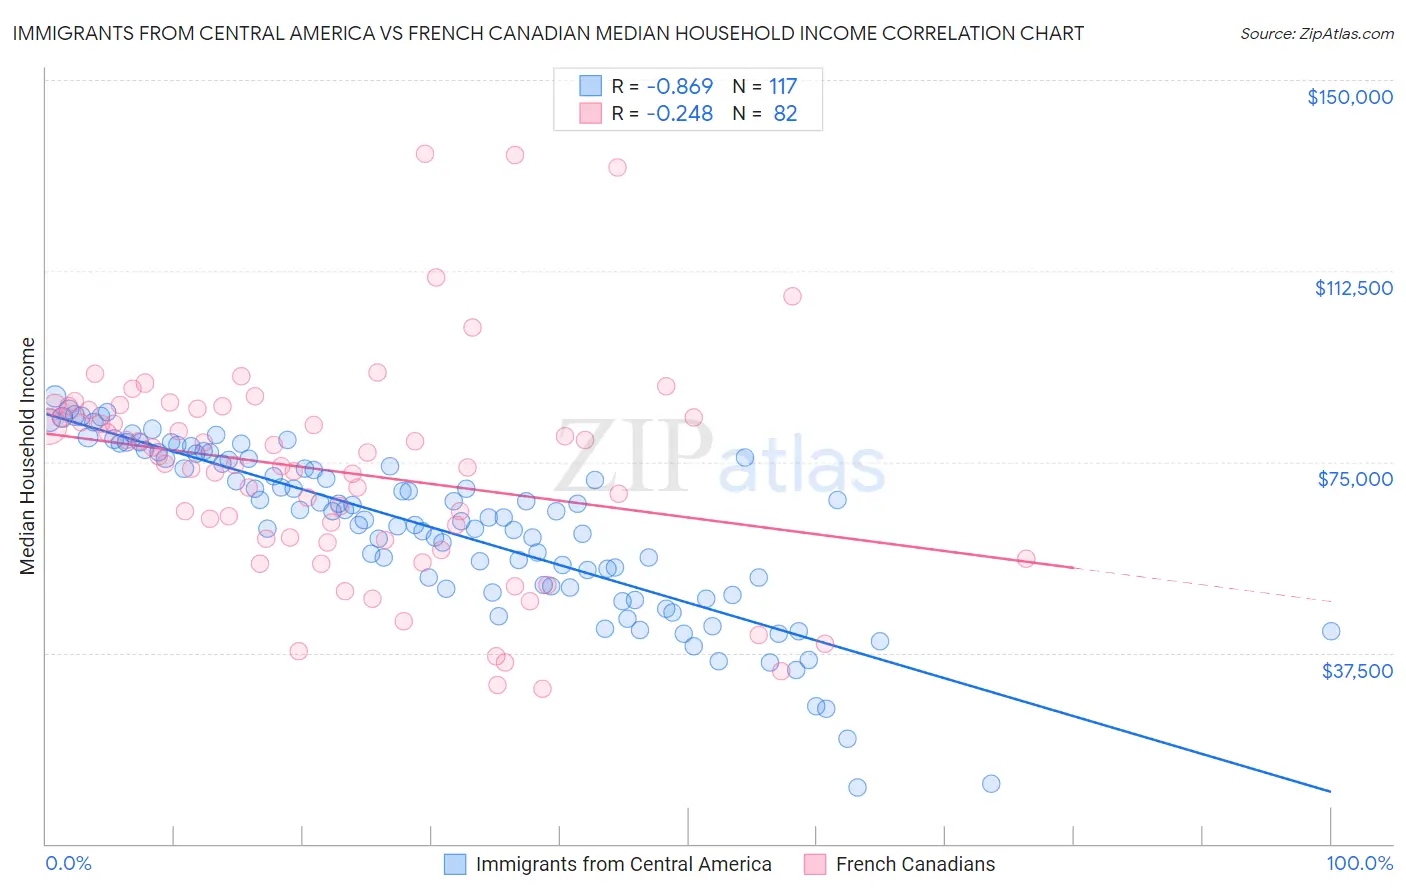
Immigrants from Central America vs French Canadian Median Household Income Correlation Chart
The statistical analysis conducted on geographies consisting of 535,748,911 people shows a very strong negative correlation between the proportion of Immigrants from Central America and median household income in the United States with a correlation coefficient (R) of -0.869 and weighted average of $74,217. Similarly, the statistical analysis conducted on geographies consisting of 502,062,501 people shows a weak negative correlation between the proportion of French Canadians and median household income in the United States with a correlation coefficient (R) of -0.248 and weighted average of $82,810, a difference of 11.6%.
Median Household Income Correlation Summary
| Measurement | Immigrants from Central America | French Canadian |
| Minimum | $11,125 | $30,469 |
| Maximum | $87,880 | $135,636 |
| Range | $76,755 | $105,167 |
| Mean | $61,825 | $72,980 |
| Median | $64,116 | $74,466 |
| Interquartile 25% (IQ1) | $50,458 | $59,768 |
| Interquartile 75% (IQ3) | $75,695 | $85,260 |
| Interquartile Range (IQR) | $25,237 | $25,493 |
| Standard Deviation (Sample) | $16,428 | $21,417 |
| Standard Deviation (Population) | $16,358 | $21,286 |
Similar Demographics by Median Household Income
Demographics Similar to Immigrants from Central America by Median Household Income
In terms of median household income, the demographic groups most similar to Immigrants from Central America are Fijian ($74,205, a difference of 0.020%), Iroquois ($74,279, a difference of 0.080%), Immigrants from Somalia ($74,300, a difference of 0.11%), Bangladeshi ($74,112, a difference of 0.14%), and Mexican ($74,399, a difference of 0.24%).
| Demographics | Rating | Rank | Median Household Income |
| Immigrants | Liberia | 0.1 /100 | #281 | Tragic $74,896 |
| Central American Indians | 0.1 /100 | #282 | Tragic $74,847 |
| Cree | 0.1 /100 | #283 | Tragic $74,685 |
| Yaqui | 0.1 /100 | #284 | Tragic $74,596 |
| Mexicans | 0.1 /100 | #285 | Tragic $74,399 |
| Immigrants | Somalia | 0.1 /100 | #286 | Tragic $74,300 |
| Iroquois | 0.1 /100 | #287 | Tragic $74,279 |
| Immigrants | Central America | 0.1 /100 | #288 | Tragic $74,217 |
| Fijians | 0.1 /100 | #289 | Tragic $74,205 |
| Bangladeshis | 0.1 /100 | #290 | Tragic $74,112 |
| Hispanics or Latinos | 0.1 /100 | #291 | Tragic $73,823 |
| Comanche | 0.1 /100 | #292 | Tragic $73,747 |
| Immigrants | Cabo Verde | 0.1 /100 | #293 | Tragic $73,515 |
| Blackfeet | 0.1 /100 | #294 | Tragic $73,509 |
| Cubans | 0.1 /100 | #295 | Tragic $73,392 |
Demographics Similar to French Canadians by Median Household Income
In terms of median household income, the demographic groups most similar to French Canadians are Dutch ($82,971, a difference of 0.19%), Immigrants from Iraq ($82,594, a difference of 0.26%), Immigrants from Uruguay ($82,560, a difference of 0.30%), Immigrants from Kenya ($83,068, a difference of 0.31%), and Salvadoran ($82,449, a difference of 0.44%).
| Demographics | Rating | Rank | Median Household Income |
| Spanish | 24.4 /100 | #201 | Fair $83,343 |
| Immigrants | Thailand | 24.3 /100 | #202 | Fair $83,327 |
| Immigrants | Cambodia | 24.0 /100 | #203 | Fair $83,304 |
| Immigrants | Africa | 23.8 /100 | #204 | Fair $83,289 |
| Celtics | 22.7 /100 | #205 | Fair $83,193 |
| Immigrants | Kenya | 21.3 /100 | #206 | Fair $83,068 |
| Dutch | 20.3 /100 | #207 | Fair $82,971 |
| French Canadians | 18.7 /100 | #208 | Poor $82,810 |
| Immigrants | Iraq | 16.7 /100 | #209 | Poor $82,594 |
| Immigrants | Uruguay | 16.4 /100 | #210 | Poor $82,560 |
| Salvadorans | 15.4 /100 | #211 | Poor $82,449 |
| Venezuelans | 15.3 /100 | #212 | Poor $82,432 |
| Nepalese | 15.1 /100 | #213 | Poor $82,410 |
| Panamanians | 14.0 /100 | #214 | Poor $82,272 |
| Vietnamese | 13.8 /100 | #215 | Poor $82,248 |