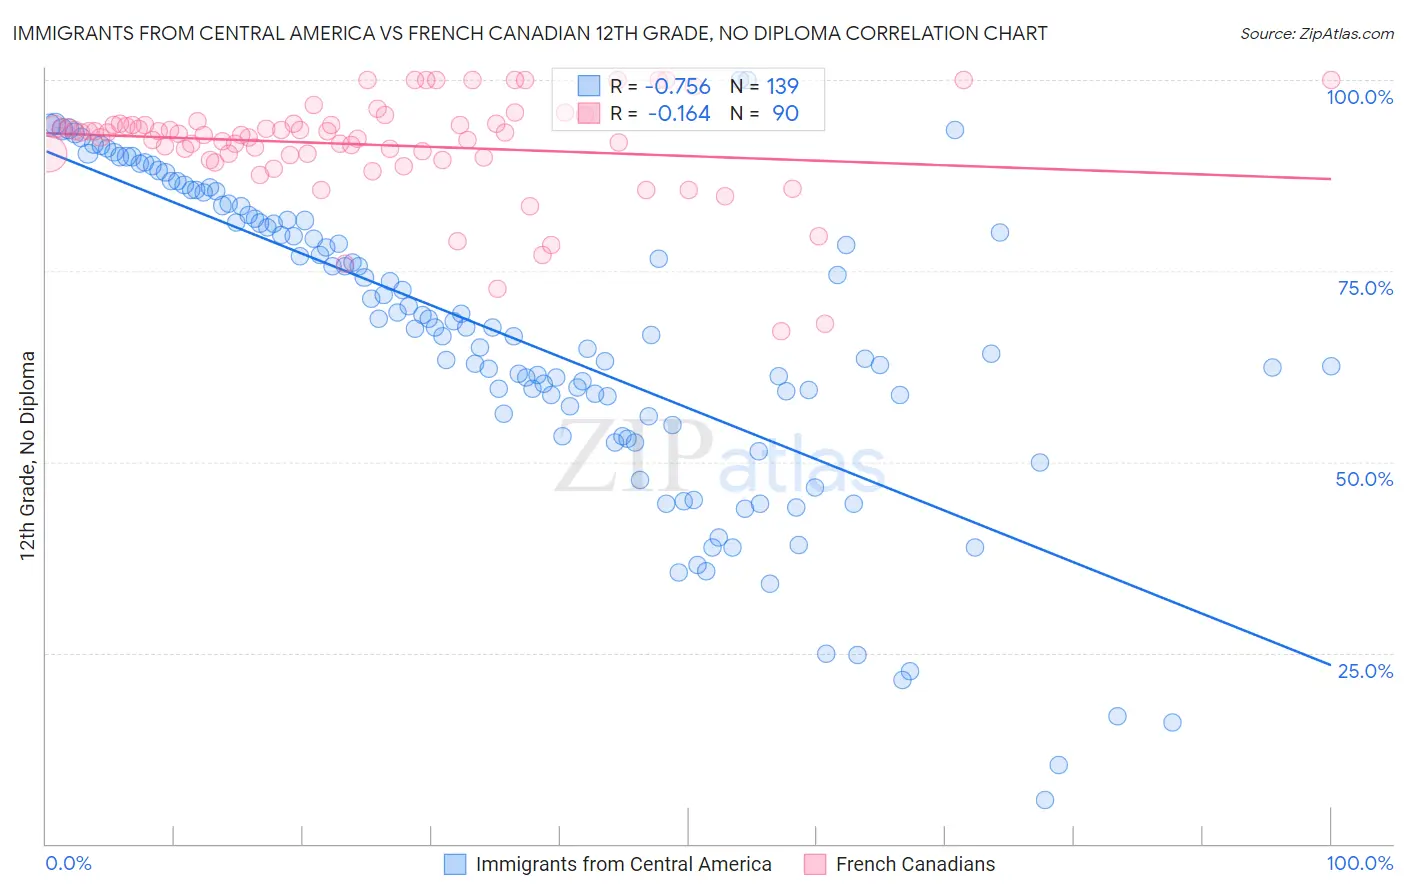
Immigrants from Central America vs French Canadian 12th Grade, No Diploma
COMPARE
Immigrants from Central America
French Canadian
12th Grade, No Diploma
12th Grade, No Diploma Comparison
Immigrants from Central America
French Canadians
83.0%
12TH GRADE, NO DIPLOMA
0.0/ 100
METRIC RATING
344th/ 347
METRIC RANK
92.6%
12TH GRADE, NO DIPLOMA
99.3/ 100
METRIC RATING
80th/ 347
METRIC RANK
Immigrants from Central America vs French Canadian 12th Grade, No Diploma Correlation Chart
The statistical analysis conducted on geographies consisting of 536,553,134 people shows a strong negative correlation between the proportion of Immigrants from Central America and percentage of population with at least 12th grade (no diploma) education in the United States with a correlation coefficient (R) of -0.756 and weighted average of 83.0%. Similarly, the statistical analysis conducted on geographies consisting of 502,678,956 people shows a poor negative correlation between the proportion of French Canadians and percentage of population with at least 12th grade (no diploma) education in the United States with a correlation coefficient (R) of -0.164 and weighted average of 92.6%, a difference of 11.6%.
12th Grade, No Diploma Correlation Summary
| Measurement | Immigrants from Central America | French Canadian |
| Minimum | 5.7% | 67.1% |
| Maximum | 100.0% | 100.0% |
| Range | 94.3% | 32.9% |
| Mean | 66.4% | 91.5% |
| Median | 67.6% | 93.0% |
| Interquartile 25% (IQ1) | 56.0% | 90.1% |
| Interquartile 75% (IQ3) | 81.8% | 94.2% |
| Interquartile Range (IQR) | 25.8% | 4.1% |
| Standard Deviation (Sample) | 20.2% | 6.6% |
| Standard Deviation (Population) | 20.1% | 6.6% |
Similar Demographics by 12th Grade, No Diploma
Demographics Similar to Immigrants from Central America by 12th Grade, No Diploma
In terms of 12th grade, no diploma, the demographic groups most similar to Immigrants from Central America are Spanish American Indian (82.9%, a difference of 0.070%), Yakama (82.5%, a difference of 0.60%), Immigrants from Mexico (82.4%, a difference of 0.64%), Immigrants from El Salvador (83.6%, a difference of 0.74%), and Houma (83.7%, a difference of 0.90%).
| Demographics | Rating | Rank | 12th Grade, No Diploma |
| Immigrants | Latin America | 0.0 /100 | #333 | Tragic 85.0% |
| Immigrants | Dominican Republic | 0.0 /100 | #334 | Tragic 84.9% |
| Immigrants | Yemen | 0.0 /100 | #335 | Tragic 84.8% |
| Tohono O'odham | 0.0 /100 | #336 | Tragic 84.7% |
| Pima | 0.0 /100 | #337 | Tragic 84.6% |
| Guatemalans | 0.0 /100 | #338 | Tragic 84.6% |
| Salvadorans | 0.0 /100 | #339 | Tragic 84.5% |
| Mexicans | 0.0 /100 | #340 | Tragic 84.1% |
| Immigrants | Guatemala | 0.0 /100 | #341 | Tragic 84.0% |
| Houma | 0.0 /100 | #342 | Tragic 83.7% |
| Immigrants | El Salvador | 0.0 /100 | #343 | Tragic 83.6% |
| Immigrants | Central America | 0.0 /100 | #344 | Tragic 83.0% |
| Spanish American Indians | 0.0 /100 | #345 | Tragic 82.9% |
| Yakama | 0.0 /100 | #346 | Tragic 82.5% |
| Immigrants | Mexico | 0.0 /100 | #347 | Tragic 82.4% |
Demographics Similar to French Canadians by 12th Grade, No Diploma
In terms of 12th grade, no diploma, the demographic groups most similar to French Canadians are Romanian (92.6%, a difference of 0.010%), Cambodian (92.6%, a difference of 0.020%), Immigrants from Denmark (92.5%, a difference of 0.020%), Immigrants from Switzerland (92.5%, a difference of 0.020%), and Immigrants from Israel (92.5%, a difference of 0.030%).
| Demographics | Rating | Rank | 12th Grade, No Diploma |
| Burmese | 99.4 /100 | #73 | Exceptional 92.6% |
| Immigrants | Moldova | 99.4 /100 | #74 | Exceptional 92.6% |
| Native Hawaiians | 99.4 /100 | #75 | Exceptional 92.6% |
| French | 99.4 /100 | #76 | Exceptional 92.6% |
| Immigrants | England | 99.4 /100 | #77 | Exceptional 92.6% |
| Cambodians | 99.3 /100 | #78 | Exceptional 92.6% |
| Romanians | 99.3 /100 | #79 | Exceptional 92.6% |
| French Canadians | 99.3 /100 | #80 | Exceptional 92.6% |
| Immigrants | Denmark | 99.2 /100 | #81 | Exceptional 92.5% |
| Immigrants | Switzerland | 99.2 /100 | #82 | Exceptional 92.5% |
| Immigrants | Israel | 99.2 /100 | #83 | Exceptional 92.5% |
| Immigrants | Bulgaria | 99.1 /100 | #84 | Exceptional 92.5% |
| Immigrants | Saudi Arabia | 99.0 /100 | #85 | Exceptional 92.5% |
| Immigrants | Turkey | 98.9 /100 | #86 | Exceptional 92.4% |
| Immigrants | France | 98.8 /100 | #87 | Exceptional 92.4% |