Immigrants from Cabo Verde vs French Canadian Median Household Income
COMPARE
Immigrants from Cabo Verde
French Canadian
Median Household Income
Median Household Income Comparison
Immigrants from Cabo Verde
French Canadians
$73,515
MEDIAN HOUSEHOLD INCOME
0.1/ 100
METRIC RATING
293rd/ 347
METRIC RANK
$82,810
MEDIAN HOUSEHOLD INCOME
18.7/ 100
METRIC RATING
208th/ 347
METRIC RANK
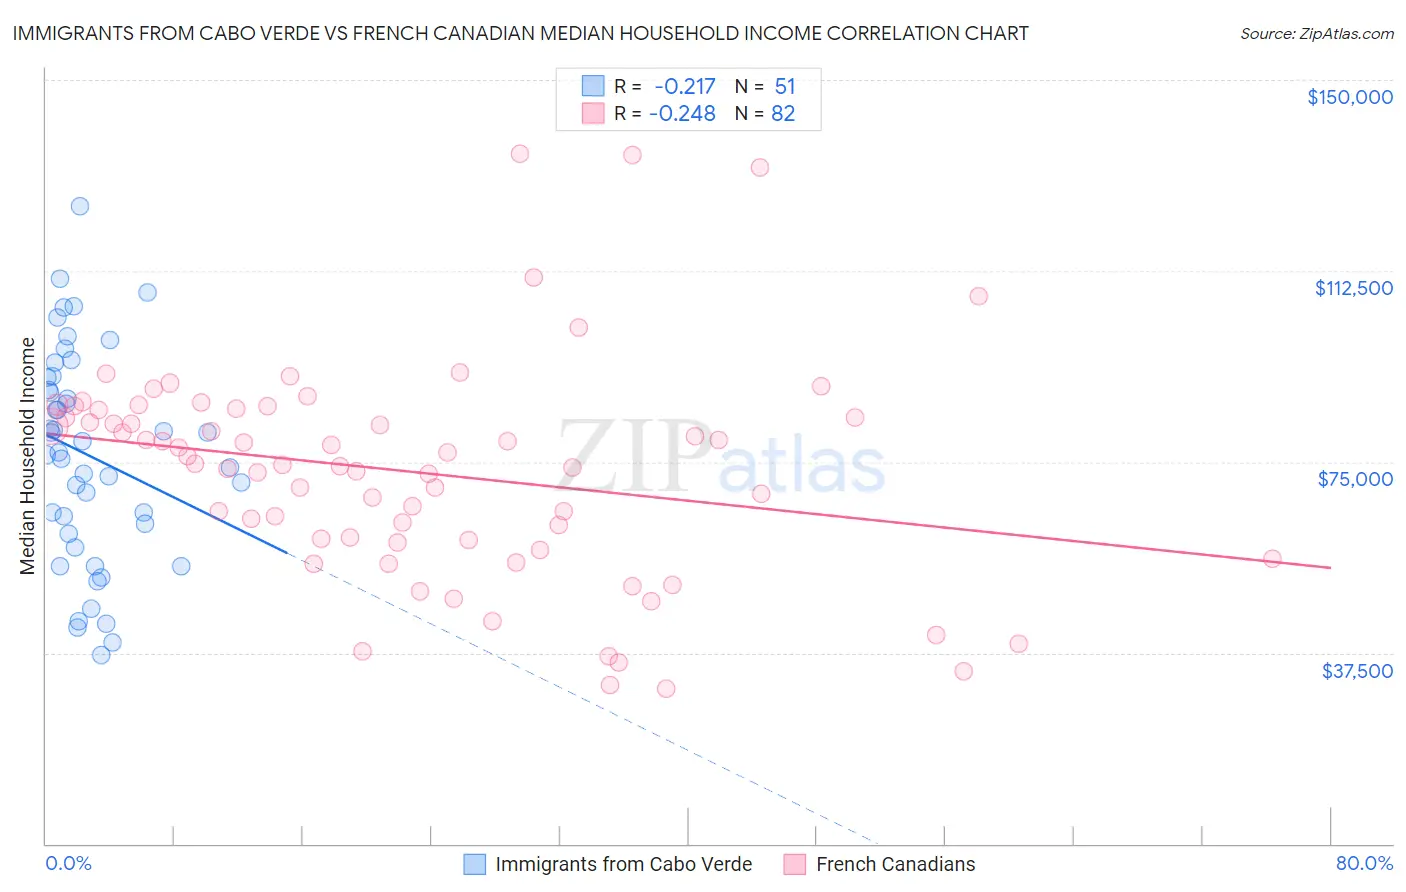
Immigrants from Cabo Verde vs French Canadian Median Household Income Correlation Chart
The statistical analysis conducted on geographies consisting of 38,130,720 people shows a weak negative correlation between the proportion of Immigrants from Cabo Verde and median household income in the United States with a correlation coefficient (R) of -0.217 and weighted average of $73,515. Similarly, the statistical analysis conducted on geographies consisting of 502,062,501 people shows a weak negative correlation between the proportion of French Canadians and median household income in the United States with a correlation coefficient (R) of -0.248 and weighted average of $82,810, a difference of 12.6%.
Median Household Income Correlation Summary
| Measurement | Immigrants from Cabo Verde | French Canadian |
| Minimum | $37,158 | $30,469 |
| Maximum | $125,130 | $135,636 |
| Range | $87,972 | $105,167 |
| Mean | $76,217 | $72,980 |
| Median | $76,886 | $74,466 |
| Interquartile 25% (IQ1) | $60,971 | $59,768 |
| Interquartile 75% (IQ3) | $91,527 | $85,260 |
| Interquartile Range (IQR) | $30,555 | $25,493 |
| Standard Deviation (Sample) | $20,748 | $21,417 |
| Standard Deviation (Population) | $20,544 | $21,286 |
Similar Demographics by Median Household Income
Demographics Similar to Immigrants from Cabo Verde by Median Household Income
In terms of median household income, the demographic groups most similar to Immigrants from Cabo Verde are Blackfeet ($73,509, a difference of 0.010%), Cuban ($73,392, a difference of 0.17%), Haitian ($73,306, a difference of 0.29%), Comanche ($73,747, a difference of 0.31%), and Hispanic or Latino ($73,823, a difference of 0.42%).
| Demographics | Rating | Rank | Median Household Income |
| Immigrants | Somalia | 0.1 /100 | #286 | Tragic $74,300 |
| Iroquois | 0.1 /100 | #287 | Tragic $74,279 |
| Immigrants | Central America | 0.1 /100 | #288 | Tragic $74,217 |
| Fijians | 0.1 /100 | #289 | Tragic $74,205 |
| Bangladeshis | 0.1 /100 | #290 | Tragic $74,112 |
| Hispanics or Latinos | 0.1 /100 | #291 | Tragic $73,823 |
| Comanche | 0.1 /100 | #292 | Tragic $73,747 |
| Immigrants | Cabo Verde | 0.1 /100 | #293 | Tragic $73,515 |
| Blackfeet | 0.1 /100 | #294 | Tragic $73,509 |
| Cubans | 0.1 /100 | #295 | Tragic $73,392 |
| Haitians | 0.1 /100 | #296 | Tragic $73,306 |
| Immigrants | Mexico | 0.0 /100 | #297 | Tragic $73,160 |
| Paiute | 0.0 /100 | #298 | Tragic $72,959 |
| Indonesians | 0.0 /100 | #299 | Tragic $72,856 |
| Immigrants | Dominica | 0.0 /100 | #300 | Tragic $72,760 |
Demographics Similar to French Canadians by Median Household Income
In terms of median household income, the demographic groups most similar to French Canadians are Dutch ($82,971, a difference of 0.19%), Immigrants from Iraq ($82,594, a difference of 0.26%), Immigrants from Uruguay ($82,560, a difference of 0.30%), Immigrants from Kenya ($83,068, a difference of 0.31%), and Salvadoran ($82,449, a difference of 0.44%).
| Demographics | Rating | Rank | Median Household Income |
| Spanish | 24.4 /100 | #201 | Fair $83,343 |
| Immigrants | Thailand | 24.3 /100 | #202 | Fair $83,327 |
| Immigrants | Cambodia | 24.0 /100 | #203 | Fair $83,304 |
| Immigrants | Africa | 23.8 /100 | #204 | Fair $83,289 |
| Celtics | 22.7 /100 | #205 | Fair $83,193 |
| Immigrants | Kenya | 21.3 /100 | #206 | Fair $83,068 |
| Dutch | 20.3 /100 | #207 | Fair $82,971 |
| French Canadians | 18.7 /100 | #208 | Poor $82,810 |
| Immigrants | Iraq | 16.7 /100 | #209 | Poor $82,594 |
| Immigrants | Uruguay | 16.4 /100 | #210 | Poor $82,560 |
| Salvadorans | 15.4 /100 | #211 | Poor $82,449 |
| Venezuelans | 15.3 /100 | #212 | Poor $82,432 |
| Nepalese | 15.1 /100 | #213 | Poor $82,410 |
| Panamanians | 14.0 /100 | #214 | Poor $82,272 |
| Vietnamese | 13.8 /100 | #215 | Poor $82,248 |