Immigrants from Central America vs Potawatomi Median Household Income
COMPARE
Immigrants from Central America
Potawatomi
Median Household Income
Median Household Income Comparison
Immigrants from Central America
Potawatomi
$74,217
MEDIAN HOUSEHOLD INCOME
0.1/ 100
METRIC RATING
288th/ 347
METRIC RANK
$72,576
MEDIAN HOUSEHOLD INCOME
0.0/ 100
METRIC RATING
306th/ 347
METRIC RANK
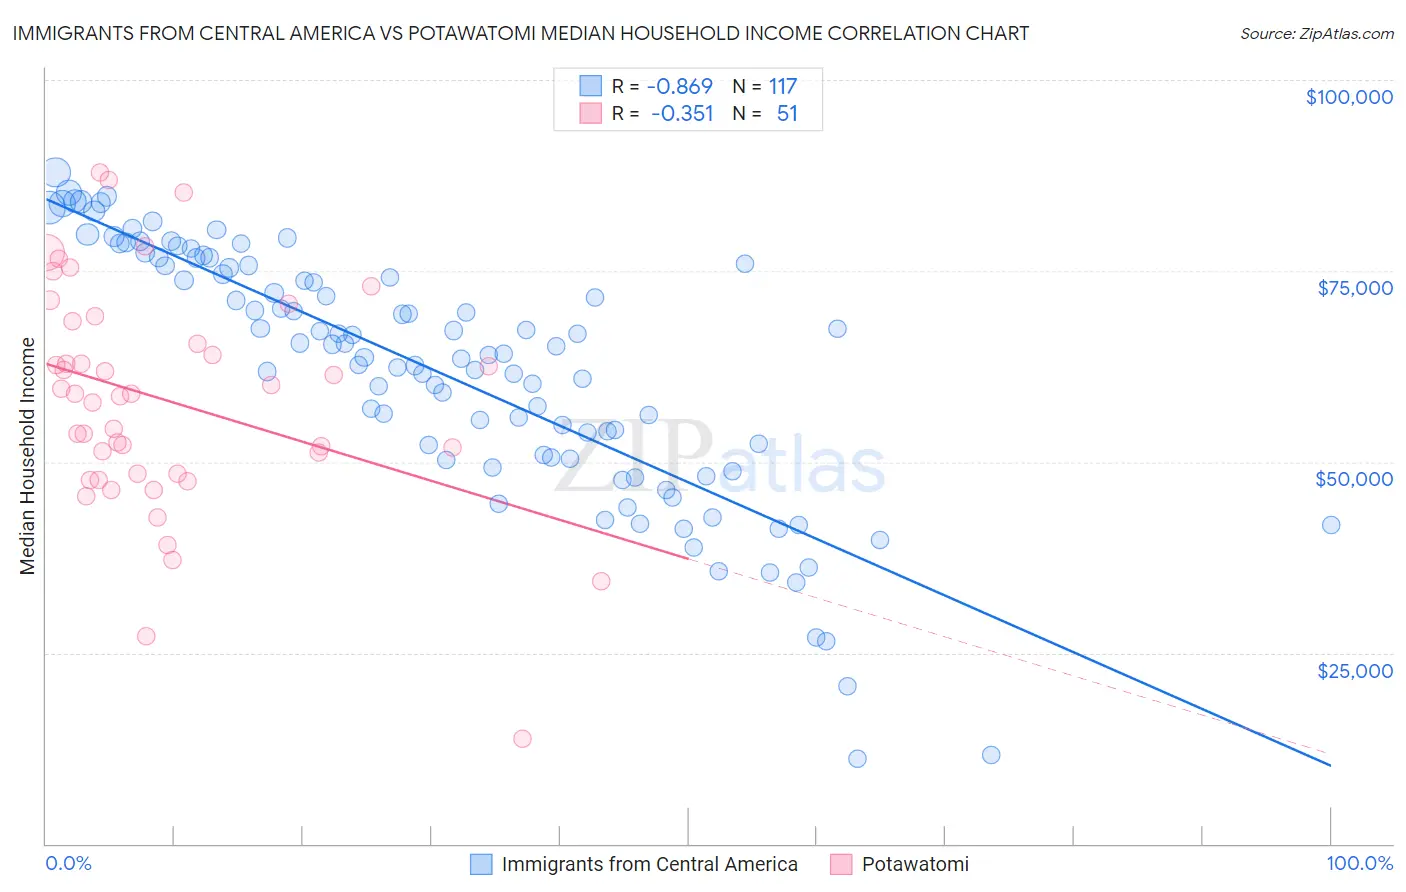
Immigrants from Central America vs Potawatomi Median Household Income Correlation Chart
The statistical analysis conducted on geographies consisting of 535,748,911 people shows a very strong negative correlation between the proportion of Immigrants from Central America and median household income in the United States with a correlation coefficient (R) of -0.869 and weighted average of $74,217. Similarly, the statistical analysis conducted on geographies consisting of 117,750,018 people shows a mild negative correlation between the proportion of Potawatomi and median household income in the United States with a correlation coefficient (R) of -0.351 and weighted average of $72,576, a difference of 2.3%.
Median Household Income Correlation Summary
| Measurement | Immigrants from Central America | Potawatomi |
| Minimum | $11,125 | $13,750 |
| Maximum | $87,880 | $87,880 |
| Range | $76,755 | $74,130 |
| Mean | $61,825 | $58,038 |
| Median | $64,116 | $58,924 |
| Interquartile 25% (IQ1) | $50,458 | $48,403 |
| Interquartile 75% (IQ3) | $75,695 | $68,477 |
| Interquartile Range (IQR) | $25,237 | $20,074 |
| Standard Deviation (Sample) | $16,428 | $14,790 |
| Standard Deviation (Population) | $16,358 | $14,645 |
Demographics Similar to Immigrants from Central America and Potawatomi by Median Household Income
In terms of median household income, the demographic groups most similar to Immigrants from Central America are Fijian ($74,205, a difference of 0.020%), Iroquois ($74,279, a difference of 0.080%), Bangladeshi ($74,112, a difference of 0.14%), Hispanic or Latino ($73,823, a difference of 0.53%), and Comanche ($73,747, a difference of 0.64%). Similarly, the demographic groups most similar to Potawatomi are Honduran ($72,588, a difference of 0.020%), Immigrants from Haiti ($72,599, a difference of 0.030%), African ($72,650, a difference of 0.10%), Shoshone ($72,660, a difference of 0.12%), and Cherokee ($72,682, a difference of 0.15%).
| Demographics | Rating | Rank | Median Household Income |
| Iroquois | 0.1 /100 | #287 | Tragic $74,279 |
| Immigrants | Central America | 0.1 /100 | #288 | Tragic $74,217 |
| Fijians | 0.1 /100 | #289 | Tragic $74,205 |
| Bangladeshis | 0.1 /100 | #290 | Tragic $74,112 |
| Hispanics or Latinos | 0.1 /100 | #291 | Tragic $73,823 |
| Comanche | 0.1 /100 | #292 | Tragic $73,747 |
| Immigrants | Cabo Verde | 0.1 /100 | #293 | Tragic $73,515 |
| Blackfeet | 0.1 /100 | #294 | Tragic $73,509 |
| Cubans | 0.1 /100 | #295 | Tragic $73,392 |
| Haitians | 0.1 /100 | #296 | Tragic $73,306 |
| Immigrants | Mexico | 0.0 /100 | #297 | Tragic $73,160 |
| Paiute | 0.0 /100 | #298 | Tragic $72,959 |
| Indonesians | 0.0 /100 | #299 | Tragic $72,856 |
| Immigrants | Dominica | 0.0 /100 | #300 | Tragic $72,760 |
| Cherokee | 0.0 /100 | #301 | Tragic $72,682 |
| Shoshone | 0.0 /100 | #302 | Tragic $72,660 |
| Africans | 0.0 /100 | #303 | Tragic $72,650 |
| Immigrants | Haiti | 0.0 /100 | #304 | Tragic $72,599 |
| Hondurans | 0.0 /100 | #305 | Tragic $72,588 |
| Potawatomi | 0.0 /100 | #306 | Tragic $72,576 |
| Ute | 0.0 /100 | #307 | Tragic $72,402 |