Panamanian vs French Canadian Median Household Income
COMPARE
Panamanian
French Canadian
Median Household Income
Median Household Income Comparison
Panamanians
French Canadians
$82,272
MEDIAN HOUSEHOLD INCOME
14.0/ 100
METRIC RATING
214th/ 347
METRIC RANK
$82,810
MEDIAN HOUSEHOLD INCOME
18.7/ 100
METRIC RATING
208th/ 347
METRIC RANK
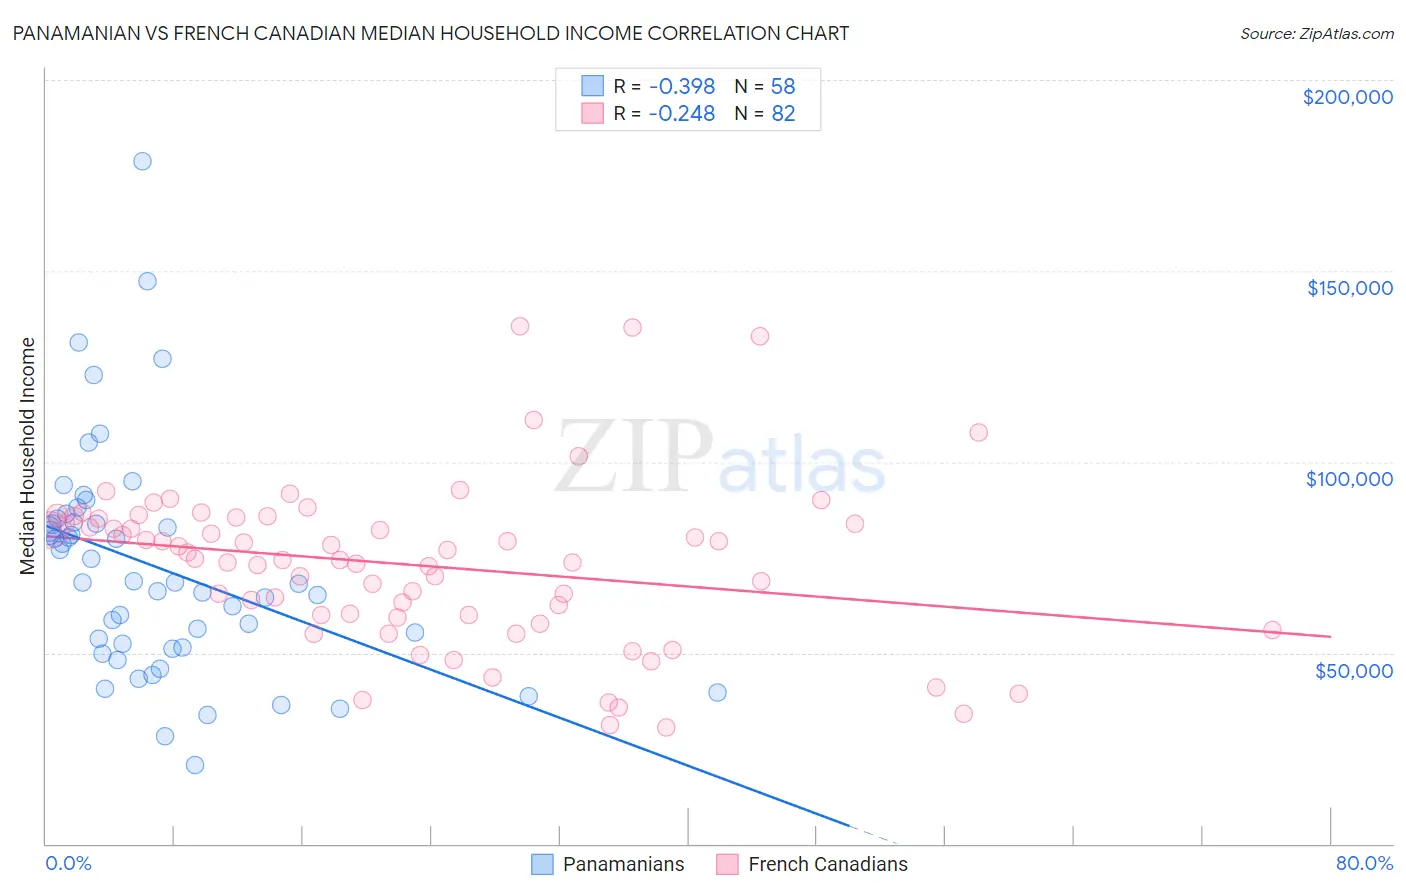
Panamanian vs French Canadian Median Household Income Correlation Chart
The statistical analysis conducted on geographies consisting of 281,034,556 people shows a mild negative correlation between the proportion of Panamanians and median household income in the United States with a correlation coefficient (R) of -0.398 and weighted average of $82,272. Similarly, the statistical analysis conducted on geographies consisting of 502,062,501 people shows a weak negative correlation between the proportion of French Canadians and median household income in the United States with a correlation coefficient (R) of -0.248 and weighted average of $82,810, a difference of 0.65%.
Median Household Income Correlation Summary
| Measurement | Panamanian | French Canadian |
| Minimum | $20,556 | $30,469 |
| Maximum | $178,834 | $135,636 |
| Range | $158,278 | $105,167 |
| Mean | $72,362 | $72,980 |
| Median | $68,346 | $74,466 |
| Interquartile 25% (IQ1) | $51,530 | $59,768 |
| Interquartile 75% (IQ3) | $83,972 | $85,260 |
| Interquartile Range (IQR) | $32,442 | $25,493 |
| Standard Deviation (Sample) | $29,634 | $21,417 |
| Standard Deviation (Population) | $29,377 | $21,286 |
Demographics Similar to Panamanians and French Canadians by Median Household Income
In terms of median household income, the demographic groups most similar to Panamanians are Vietnamese ($82,248, a difference of 0.030%), Yugoslavian ($82,186, a difference of 0.10%), Nepalese ($82,410, a difference of 0.17%), Venezuelan ($82,432, a difference of 0.20%), and Salvadoran ($82,449, a difference of 0.22%). Similarly, the demographic groups most similar to French Canadians are Dutch ($82,971, a difference of 0.19%), Immigrants from Iraq ($82,594, a difference of 0.26%), Immigrants from Uruguay ($82,560, a difference of 0.30%), Immigrants from Kenya ($83,068, a difference of 0.31%), and Salvadoran ($82,449, a difference of 0.44%).
| Demographics | Rating | Rank | Median Household Income |
| Spanish | 24.4 /100 | #201 | Fair $83,343 |
| Immigrants | Thailand | 24.3 /100 | #202 | Fair $83,327 |
| Immigrants | Cambodia | 24.0 /100 | #203 | Fair $83,304 |
| Immigrants | Africa | 23.8 /100 | #204 | Fair $83,289 |
| Celtics | 22.7 /100 | #205 | Fair $83,193 |
| Immigrants | Kenya | 21.3 /100 | #206 | Fair $83,068 |
| Dutch | 20.3 /100 | #207 | Fair $82,971 |
| French Canadians | 18.7 /100 | #208 | Poor $82,810 |
| Immigrants | Iraq | 16.7 /100 | #209 | Poor $82,594 |
| Immigrants | Uruguay | 16.4 /100 | #210 | Poor $82,560 |
| Salvadorans | 15.4 /100 | #211 | Poor $82,449 |
| Venezuelans | 15.3 /100 | #212 | Poor $82,432 |
| Nepalese | 15.1 /100 | #213 | Poor $82,410 |
| Panamanians | 14.0 /100 | #214 | Poor $82,272 |
| Vietnamese | 13.8 /100 | #215 | Poor $82,248 |
| Yugoslavians | 13.3 /100 | #216 | Poor $82,186 |
| Ecuadorians | 12.5 /100 | #217 | Poor $82,070 |
| Whites/Caucasians | 12.2 /100 | #218 | Poor $82,029 |
| Nigerians | 10.3 /100 | #219 | Poor $81,725 |
| Immigrants | Venezuela | 9.0 /100 | #220 | Tragic $81,506 |
| Immigrants | Ghana | 9.0 /100 | #221 | Tragic $81,489 |