Croatian vs French Canadian Median Household Income
COMPARE
Croatian
French Canadian
Median Household Income
Median Household Income Comparison
Croatians
French Canadians
$90,685
MEDIAN HOUSEHOLD INCOME
97.3/ 100
METRIC RATING
107th/ 347
METRIC RANK
$82,810
MEDIAN HOUSEHOLD INCOME
18.7/ 100
METRIC RATING
208th/ 347
METRIC RANK
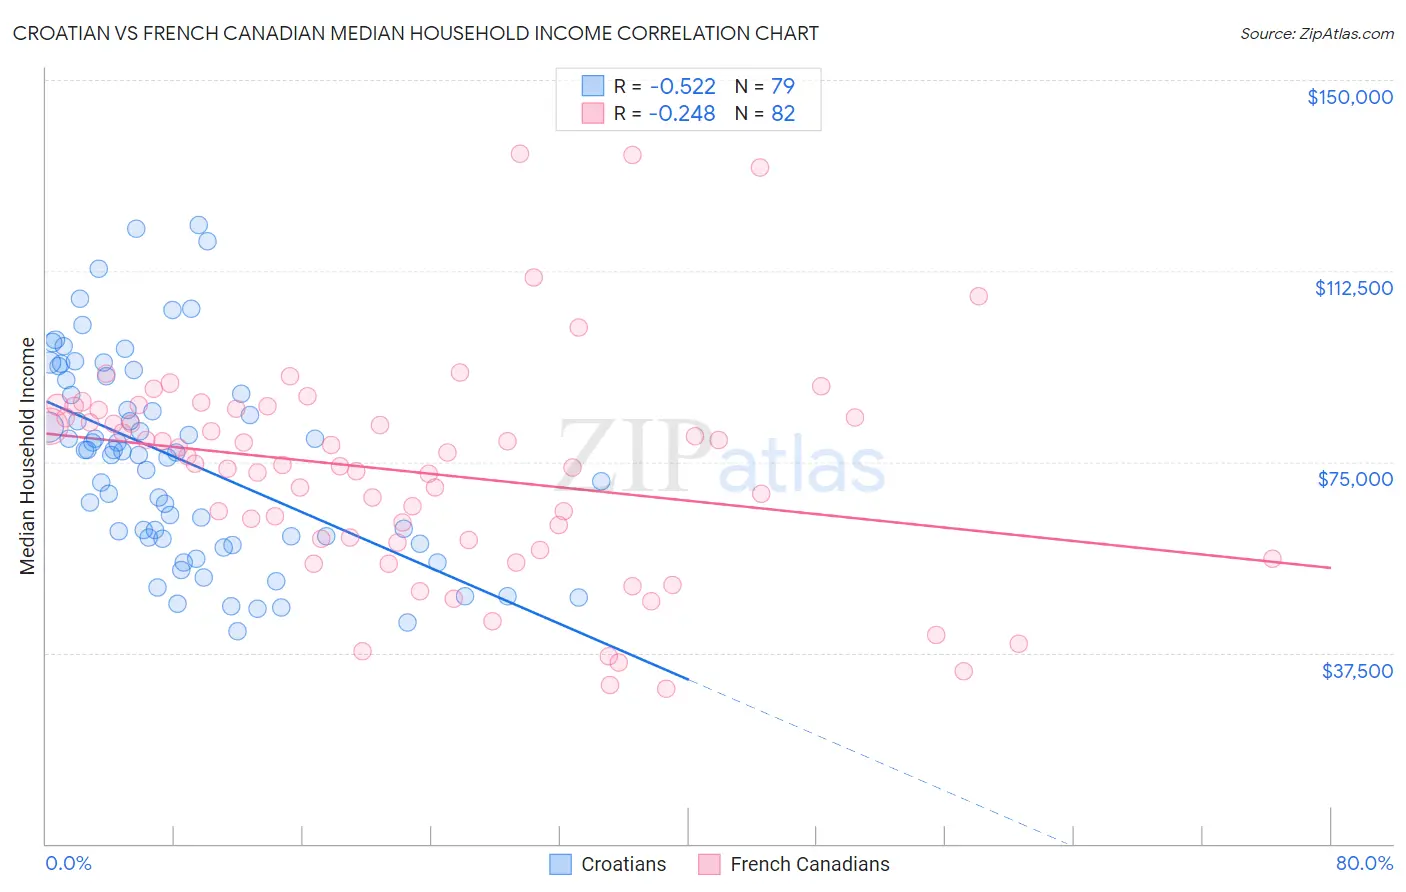
Croatian vs French Canadian Median Household Income Correlation Chart
The statistical analysis conducted on geographies consisting of 375,471,157 people shows a substantial negative correlation between the proportion of Croatians and median household income in the United States with a correlation coefficient (R) of -0.522 and weighted average of $90,685. Similarly, the statistical analysis conducted on geographies consisting of 502,062,501 people shows a weak negative correlation between the proportion of French Canadians and median household income in the United States with a correlation coefficient (R) of -0.248 and weighted average of $82,810, a difference of 9.5%.
Median Household Income Correlation Summary
| Measurement | Croatian | French Canadian |
| Minimum | $41,696 | $30,469 |
| Maximum | $121,425 | $135,636 |
| Range | $79,729 | $105,167 |
| Mean | $75,345 | $72,980 |
| Median | $76,836 | $74,466 |
| Interquartile 25% (IQ1) | $59,949 | $59,768 |
| Interquartile 75% (IQ3) | $91,012 | $85,260 |
| Interquartile Range (IQR) | $31,063 | $25,493 |
| Standard Deviation (Sample) | $19,789 | $21,417 |
| Standard Deviation (Population) | $19,663 | $21,286 |
Similar Demographics by Median Household Income
Demographics Similar to Croatians by Median Household Income
In terms of median household income, the demographic groups most similar to Croatians are Zimbabwean ($90,618, a difference of 0.070%), Macedonian ($90,761, a difference of 0.080%), Chilean ($90,605, a difference of 0.090%), Palestinian ($90,574, a difference of 0.12%), and Immigrants from Poland ($90,549, a difference of 0.15%).
| Demographics | Rating | Rank | Median Household Income |
| Ukrainians | 98.3 /100 | #100 | Exceptional $91,456 |
| Immigrants | Moldova | 98.3 /100 | #101 | Exceptional $91,446 |
| Austrians | 98.2 /100 | #102 | Exceptional $91,339 |
| Immigrants | Ukraine | 98.0 /100 | #103 | Exceptional $91,124 |
| Immigrants | Kazakhstan | 97.8 /100 | #104 | Exceptional $91,015 |
| Immigrants | Brazil | 97.7 /100 | #105 | Exceptional $90,907 |
| Macedonians | 97.4 /100 | #106 | Exceptional $90,761 |
| Croatians | 97.3 /100 | #107 | Exceptional $90,685 |
| Zimbabweans | 97.2 /100 | #108 | Exceptional $90,618 |
| Chileans | 97.2 /100 | #109 | Exceptional $90,605 |
| Palestinians | 97.1 /100 | #110 | Exceptional $90,574 |
| Immigrants | Poland | 97.1 /100 | #111 | Exceptional $90,549 |
| Northern Europeans | 96.9 /100 | #112 | Exceptional $90,446 |
| Peruvians | 96.5 /100 | #113 | Exceptional $90,261 |
| Immigrants | Northern Africa | 95.9 /100 | #114 | Exceptional $90,026 |
Demographics Similar to French Canadians by Median Household Income
In terms of median household income, the demographic groups most similar to French Canadians are Dutch ($82,971, a difference of 0.19%), Immigrants from Iraq ($82,594, a difference of 0.26%), Immigrants from Uruguay ($82,560, a difference of 0.30%), Immigrants from Kenya ($83,068, a difference of 0.31%), and Salvadoran ($82,449, a difference of 0.44%).
| Demographics | Rating | Rank | Median Household Income |
| Spanish | 24.4 /100 | #201 | Fair $83,343 |
| Immigrants | Thailand | 24.3 /100 | #202 | Fair $83,327 |
| Immigrants | Cambodia | 24.0 /100 | #203 | Fair $83,304 |
| Immigrants | Africa | 23.8 /100 | #204 | Fair $83,289 |
| Celtics | 22.7 /100 | #205 | Fair $83,193 |
| Immigrants | Kenya | 21.3 /100 | #206 | Fair $83,068 |
| Dutch | 20.3 /100 | #207 | Fair $82,971 |
| French Canadians | 18.7 /100 | #208 | Poor $82,810 |
| Immigrants | Iraq | 16.7 /100 | #209 | Poor $82,594 |
| Immigrants | Uruguay | 16.4 /100 | #210 | Poor $82,560 |
| Salvadorans | 15.4 /100 | #211 | Poor $82,449 |
| Venezuelans | 15.3 /100 | #212 | Poor $82,432 |
| Nepalese | 15.1 /100 | #213 | Poor $82,410 |
| Panamanians | 14.0 /100 | #214 | Poor $82,272 |
| Vietnamese | 13.8 /100 | #215 | Poor $82,248 |