Immigrants from Central America vs French Canadian Median Earnings
COMPARE
Immigrants from Central America
French Canadian
Median Earnings
Median Earnings Comparison
Immigrants from Central America
French Canadians
$39,762
MEDIAN EARNINGS
0.0/ 100
METRIC RATING
322nd/ 347
METRIC RANK
$46,026
MEDIAN EARNINGS
36.1/ 100
METRIC RATING
190th/ 347
METRIC RANK
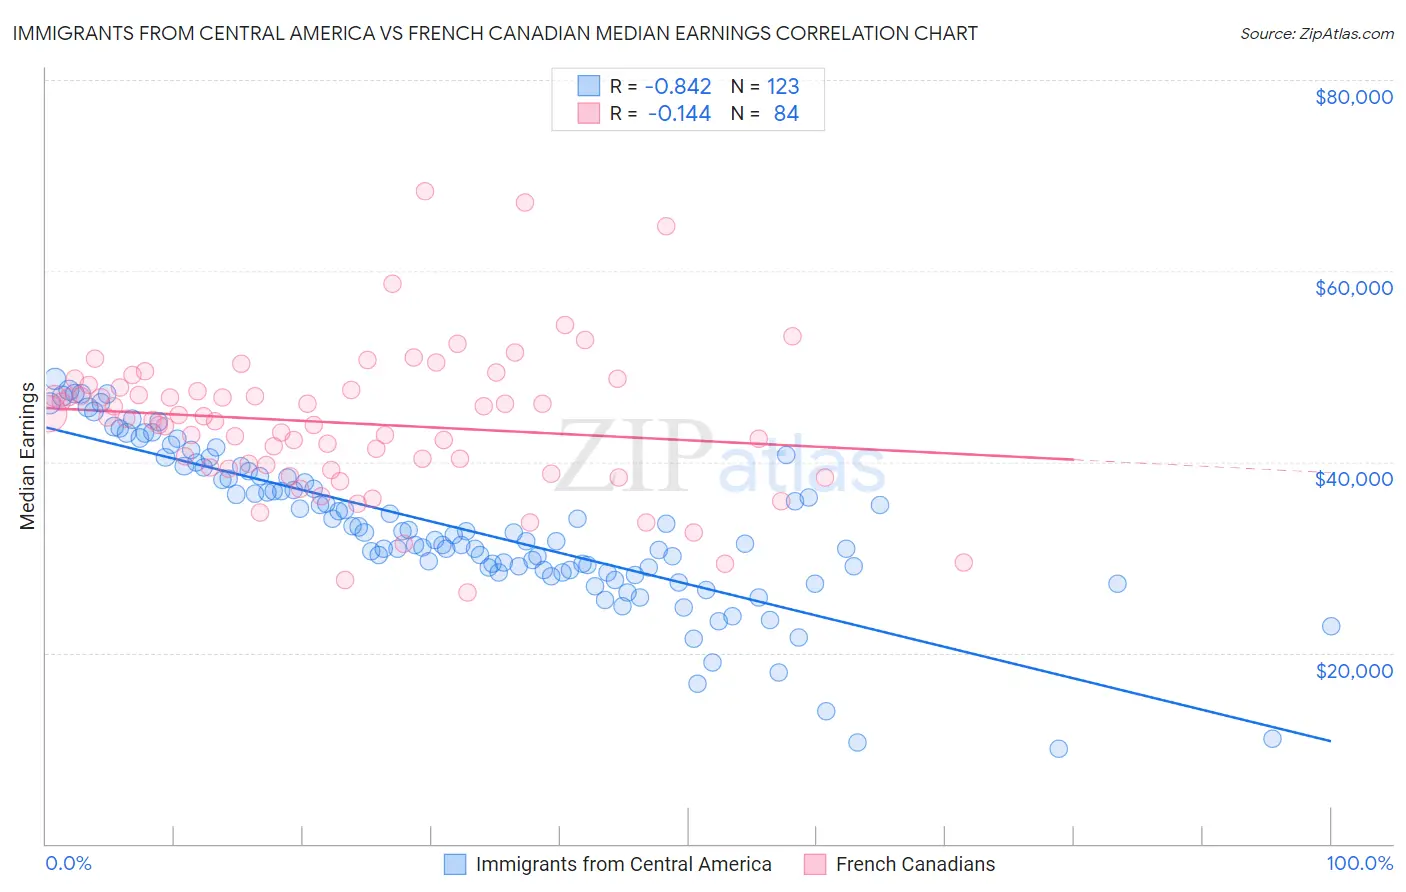
Immigrants from Central America vs French Canadian Median Earnings Correlation Chart
The statistical analysis conducted on geographies consisting of 536,322,180 people shows a very strong negative correlation between the proportion of Immigrants from Central America and median earnings in the United States with a correlation coefficient (R) of -0.842 and weighted average of $39,762. Similarly, the statistical analysis conducted on geographies consisting of 502,564,111 people shows a poor negative correlation between the proportion of French Canadians and median earnings in the United States with a correlation coefficient (R) of -0.144 and weighted average of $46,026, a difference of 15.8%.
Median Earnings Correlation Summary
| Measurement | Immigrants from Central America | French Canadian |
| Minimum | $9,917 | $26,346 |
| Maximum | $48,696 | $68,284 |
| Range | $38,779 | $41,938 |
| Mean | $33,043 | $44,063 |
| Median | $32,380 | $44,489 |
| Interquartile 25% (IQ1) | $28,620 | $39,382 |
| Interquartile 75% (IQ3) | $38,496 | $47,671 |
| Interquartile Range (IQR) | $9,875 | $8,289 |
| Standard Deviation (Sample) | $8,045 | $7,666 |
| Standard Deviation (Population) | $8,012 | $7,620 |
Similar Demographics by Median Earnings
Demographics Similar to Immigrants from Central America by Median Earnings
In terms of median earnings, the demographic groups most similar to Immigrants from Central America are Bahamian ($39,735, a difference of 0.070%), Ottawa ($39,721, a difference of 0.10%), Mexican ($39,834, a difference of 0.18%), Immigrants from Bahamas ($39,861, a difference of 0.25%), and Creek ($39,648, a difference of 0.29%).
| Demographics | Rating | Rank | Median Earnings |
| Seminole | 0.0 /100 | #315 | Tragic $40,233 |
| Immigrants | Honduras | 0.0 /100 | #316 | Tragic $40,195 |
| Fijians | 0.0 /100 | #317 | Tragic $40,193 |
| Dutch West Indians | 0.0 /100 | #318 | Tragic $40,107 |
| Blacks/African Americans | 0.0 /100 | #319 | Tragic $40,085 |
| Immigrants | Bahamas | 0.0 /100 | #320 | Tragic $39,861 |
| Mexicans | 0.0 /100 | #321 | Tragic $39,834 |
| Immigrants | Central America | 0.0 /100 | #322 | Tragic $39,762 |
| Bahamians | 0.0 /100 | #323 | Tragic $39,735 |
| Ottawa | 0.0 /100 | #324 | Tragic $39,721 |
| Creek | 0.0 /100 | #325 | Tragic $39,648 |
| Immigrants | Yemen | 0.0 /100 | #326 | Tragic $39,540 |
| Yuman | 0.0 /100 | #327 | Tragic $39,523 |
| Sioux | 0.0 /100 | #328 | Tragic $39,448 |
| Kiowa | 0.0 /100 | #329 | Tragic $39,232 |
Demographics Similar to French Canadians by Median Earnings
In terms of median earnings, the demographic groups most similar to French Canadians are Spaniard ($46,059, a difference of 0.070%), Immigrants from Armenia ($46,094, a difference of 0.15%), Finnish ($45,940, a difference of 0.19%), German ($45,935, a difference of 0.20%), and Guamanian/Chamorro ($45,933, a difference of 0.20%).
| Demographics | Rating | Rank | Median Earnings |
| French | 45.2 /100 | #183 | Average $46,296 |
| Immigrants | Kenya | 42.4 /100 | #184 | Average $46,214 |
| Uruguayans | 41.6 /100 | #185 | Average $46,190 |
| Vietnamese | 40.9 /100 | #186 | Average $46,172 |
| Iraqis | 39.9 /100 | #187 | Fair $46,140 |
| Immigrants | Armenia | 38.3 /100 | #188 | Fair $46,094 |
| Spaniards | 37.2 /100 | #189 | Fair $46,059 |
| French Canadians | 36.1 /100 | #190 | Fair $46,026 |
| Finns | 33.4 /100 | #191 | Fair $45,940 |
| Germans | 33.2 /100 | #192 | Fair $45,935 |
| Guamanians/Chamorros | 33.2 /100 | #193 | Fair $45,933 |
| Immigrants | Costa Rica | 33.0 /100 | #194 | Fair $45,928 |
| Immigrants | St. Vincent and the Grenadines | 32.4 /100 | #195 | Fair $45,908 |
| Yugoslavians | 30.5 /100 | #196 | Fair $45,846 |
| Barbadians | 30.5 /100 | #197 | Fair $45,846 |