Immigrants from Bosnia and Herzegovina vs French Canadian Median Household Income
COMPARE
Immigrants from Bosnia and Herzegovina
French Canadian
Median Household Income
Median Household Income Comparison
Immigrants from Bosnia and Herzegovina
French Canadians
$79,888
MEDIAN HOUSEHOLD INCOME
3.4/ 100
METRIC RATING
236th/ 347
METRIC RANK
$82,810
MEDIAN HOUSEHOLD INCOME
18.7/ 100
METRIC RATING
208th/ 347
METRIC RANK
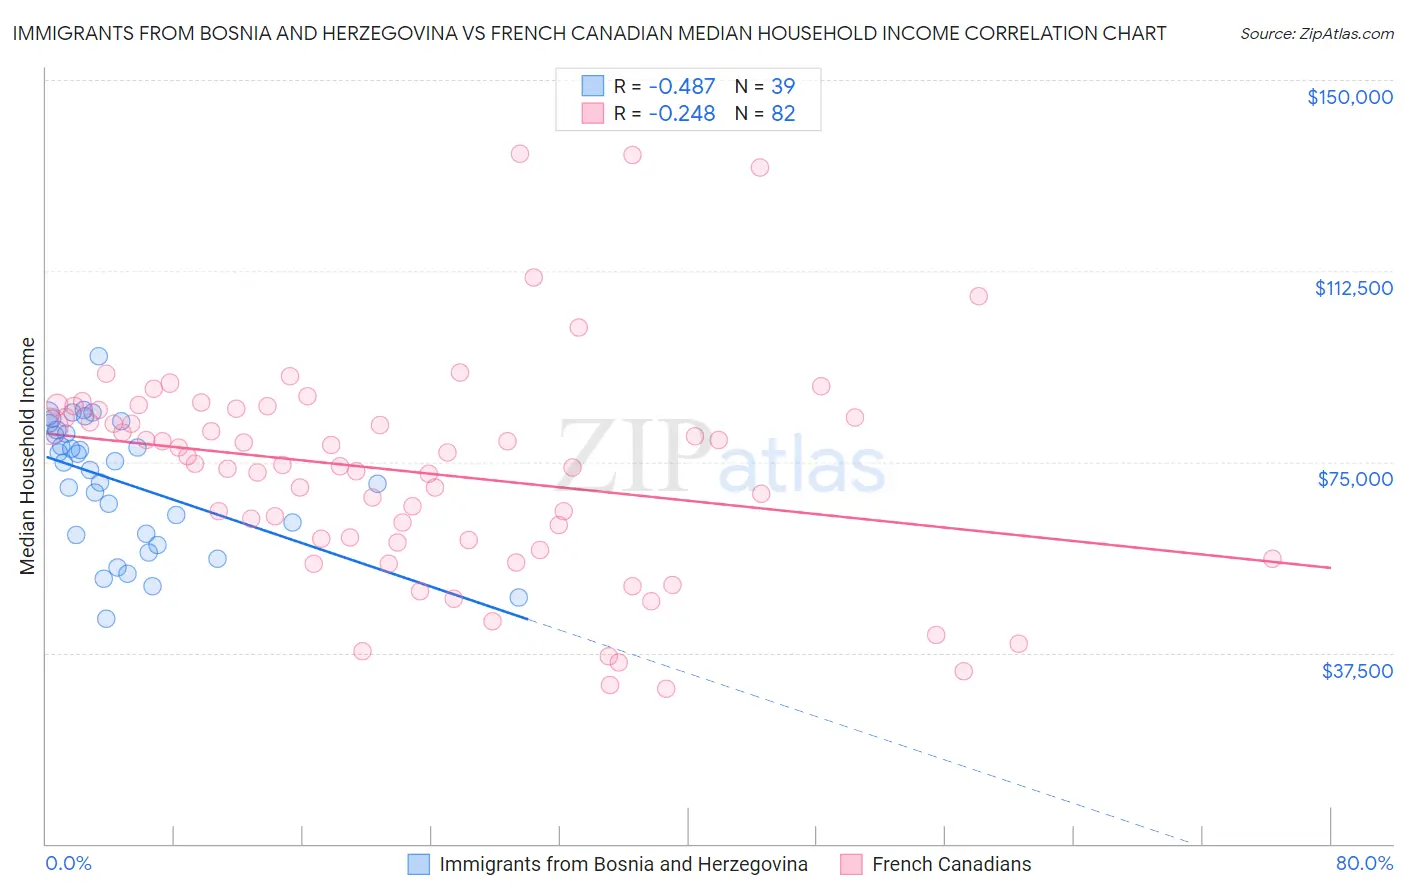
Immigrants from Bosnia and Herzegovina vs French Canadian Median Household Income Correlation Chart
The statistical analysis conducted on geographies consisting of 156,785,228 people shows a moderate negative correlation between the proportion of Immigrants from Bosnia and Herzegovina and median household income in the United States with a correlation coefficient (R) of -0.487 and weighted average of $79,888. Similarly, the statistical analysis conducted on geographies consisting of 502,062,501 people shows a weak negative correlation between the proportion of French Canadians and median household income in the United States with a correlation coefficient (R) of -0.248 and weighted average of $82,810, a difference of 3.7%.
Median Household Income Correlation Summary
| Measurement | Immigrants from Bosnia and Herzegovina | French Canadian |
| Minimum | $44,295 | $30,469 |
| Maximum | $95,813 | $135,636 |
| Range | $51,518 | $105,167 |
| Mean | $71,018 | $72,980 |
| Median | $74,982 | $74,466 |
| Interquartile 25% (IQ1) | $60,735 | $59,768 |
| Interquartile 75% (IQ3) | $81,375 | $85,260 |
| Interquartile Range (IQR) | $20,640 | $25,493 |
| Standard Deviation (Sample) | $12,624 | $21,417 |
| Standard Deviation (Population) | $12,461 | $21,286 |
Similar Demographics by Median Household Income
Demographics Similar to Immigrants from Bosnia and Herzegovina by Median Household Income
In terms of median household income, the demographic groups most similar to Immigrants from Bosnia and Herzegovina are Nicaraguan ($79,737, a difference of 0.19%), Barbadian ($79,664, a difference of 0.28%), Alaska Native ($79,509, a difference of 0.48%), Immigrants from Western Africa ($79,490, a difference of 0.50%), and Immigrants from Guyana ($80,324, a difference of 0.55%).
| Demographics | Rating | Rank | Median Household Income |
| Delaware | 5.0 /100 | #229 | Tragic $80,527 |
| Bermudans | 4.7 /100 | #230 | Tragic $80,406 |
| Trinidadians and Tobagonians | 4.7 /100 | #231 | Tragic $80,402 |
| Immigrants | Trinidad and Tobago | 4.6 /100 | #232 | Tragic $80,373 |
| Immigrants | Azores | 4.5 /100 | #233 | Tragic $80,357 |
| Immigrants | Ecuador | 4.5 /100 | #234 | Tragic $80,341 |
| Immigrants | Guyana | 4.5 /100 | #235 | Tragic $80,324 |
| Immigrants | Bosnia and Herzegovina | 3.4 /100 | #236 | Tragic $79,888 |
| Nicaraguans | 3.1 /100 | #237 | Tragic $79,737 |
| Barbadians | 3.0 /100 | #238 | Tragic $79,664 |
| Alaska Natives | 2.7 /100 | #239 | Tragic $79,509 |
| Immigrants | Western Africa | 2.7 /100 | #240 | Tragic $79,490 |
| Immigrants | Nonimmigrants | 2.6 /100 | #241 | Tragic $79,429 |
| Immigrants | Sudan | 2.1 /100 | #242 | Tragic $79,103 |
| Immigrants | Barbados | 1.9 /100 | #243 | Tragic $78,989 |
Demographics Similar to French Canadians by Median Household Income
In terms of median household income, the demographic groups most similar to French Canadians are Dutch ($82,971, a difference of 0.19%), Immigrants from Iraq ($82,594, a difference of 0.26%), Immigrants from Uruguay ($82,560, a difference of 0.30%), Immigrants from Kenya ($83,068, a difference of 0.31%), and Salvadoran ($82,449, a difference of 0.44%).
| Demographics | Rating | Rank | Median Household Income |
| Spanish | 24.4 /100 | #201 | Fair $83,343 |
| Immigrants | Thailand | 24.3 /100 | #202 | Fair $83,327 |
| Immigrants | Cambodia | 24.0 /100 | #203 | Fair $83,304 |
| Immigrants | Africa | 23.8 /100 | #204 | Fair $83,289 |
| Celtics | 22.7 /100 | #205 | Fair $83,193 |
| Immigrants | Kenya | 21.3 /100 | #206 | Fair $83,068 |
| Dutch | 20.3 /100 | #207 | Fair $82,971 |
| French Canadians | 18.7 /100 | #208 | Poor $82,810 |
| Immigrants | Iraq | 16.7 /100 | #209 | Poor $82,594 |
| Immigrants | Uruguay | 16.4 /100 | #210 | Poor $82,560 |
| Salvadorans | 15.4 /100 | #211 | Poor $82,449 |
| Venezuelans | 15.3 /100 | #212 | Poor $82,432 |
| Nepalese | 15.1 /100 | #213 | Poor $82,410 |
| Panamanians | 14.0 /100 | #214 | Poor $82,272 |
| Vietnamese | 13.8 /100 | #215 | Poor $82,248 |