Immigrants from South Africa vs French Canadian Median Household Income
COMPARE
Immigrants from South Africa
French Canadian
Median Household Income
Median Household Income Comparison
Immigrants from South Africa
French Canadians
$95,800
MEDIAN HOUSEHOLD INCOME
99.9/ 100
METRIC RATING
52nd/ 347
METRIC RANK
$82,810
MEDIAN HOUSEHOLD INCOME
18.7/ 100
METRIC RATING
208th/ 347
METRIC RANK
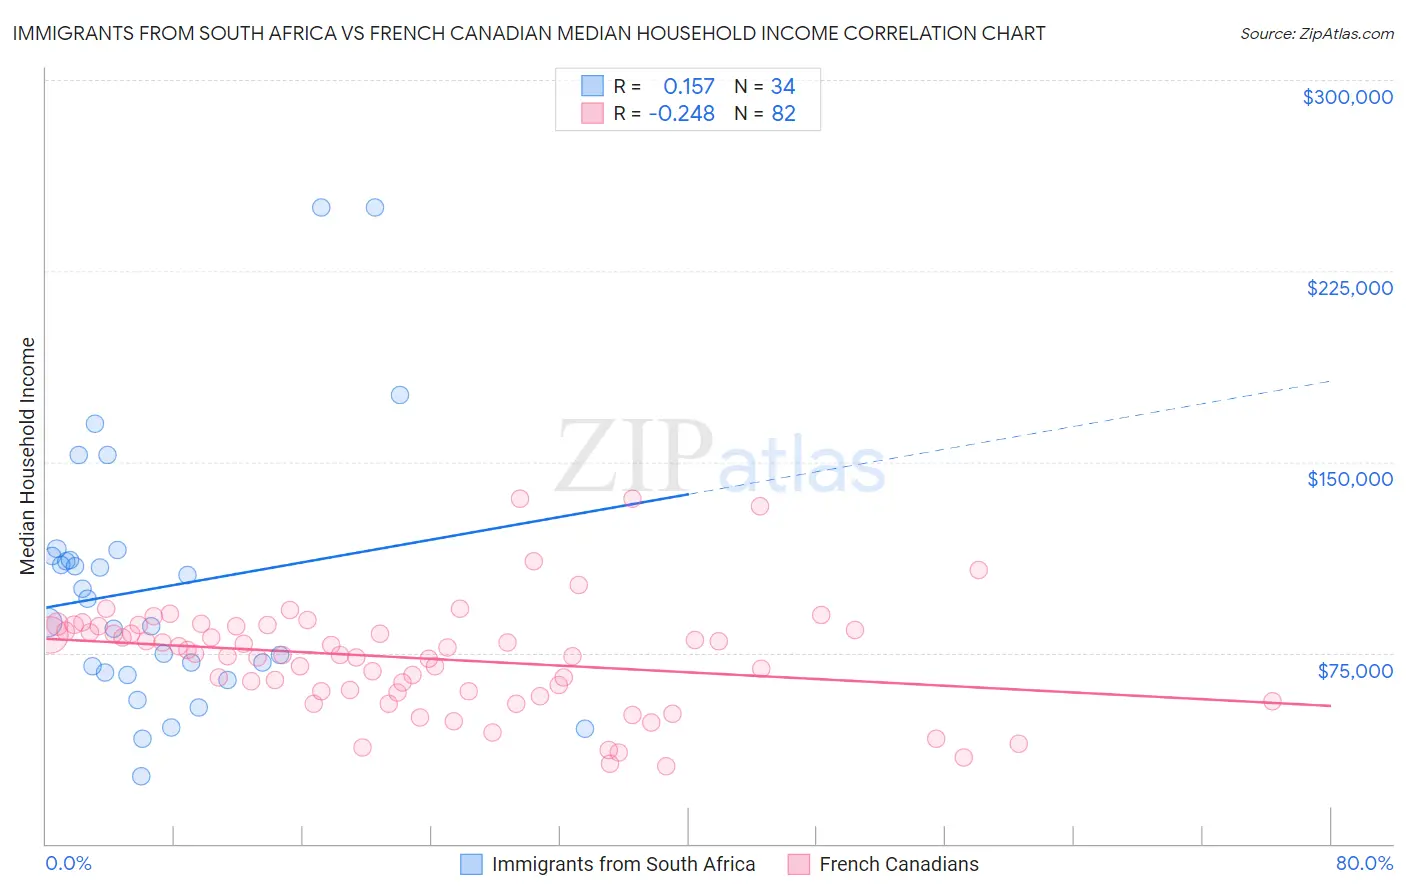
Immigrants from South Africa vs French Canadian Median Household Income Correlation Chart
The statistical analysis conducted on geographies consisting of 233,255,435 people shows a poor positive correlation between the proportion of Immigrants from South Africa and median household income in the United States with a correlation coefficient (R) of 0.157 and weighted average of $95,800. Similarly, the statistical analysis conducted on geographies consisting of 502,062,501 people shows a weak negative correlation between the proportion of French Canadians and median household income in the United States with a correlation coefficient (R) of -0.248 and weighted average of $82,810, a difference of 15.7%.
Median Household Income Correlation Summary
| Measurement | Immigrants from South Africa | French Canadian |
| Minimum | $26,321 | $30,469 |
| Maximum | $250,001 | $135,636 |
| Range | $223,680 | $105,167 |
| Mean | $100,741 | $72,980 |
| Median | $91,620 | $74,466 |
| Interquartile 25% (IQ1) | $67,153 | $59,768 |
| Interquartile 75% (IQ3) | $112,945 | $85,260 |
| Interquartile Range (IQR) | $45,792 | $25,493 |
| Standard Deviation (Sample) | $51,810 | $21,417 |
| Standard Deviation (Population) | $51,042 | $21,286 |
Similar Demographics by Median Household Income
Demographics Similar to Immigrants from South Africa by Median Household Income
In terms of median household income, the demographic groups most similar to Immigrants from South Africa are Paraguayan ($95,737, a difference of 0.070%), Egyptian ($95,673, a difference of 0.13%), Estonian ($95,930, a difference of 0.14%), Immigrants from Czechoslovakia ($95,319, a difference of 0.50%), and Immigrants from Malaysia ($96,292, a difference of 0.51%).
| Demographics | Rating | Rank | Median Household Income |
| Israelis | 99.9 /100 | #45 | Exceptional $96,552 |
| Australians | 99.9 /100 | #46 | Exceptional $96,490 |
| Immigrants | Russia | 99.9 /100 | #47 | Exceptional $96,378 |
| Cambodians | 99.9 /100 | #48 | Exceptional $96,324 |
| Immigrants | Malaysia | 99.9 /100 | #49 | Exceptional $96,292 |
| Bulgarians | 99.9 /100 | #50 | Exceptional $96,290 |
| Estonians | 99.9 /100 | #51 | Exceptional $95,930 |
| Immigrants | South Africa | 99.9 /100 | #52 | Exceptional $95,800 |
| Paraguayans | 99.9 /100 | #53 | Exceptional $95,737 |
| Egyptians | 99.9 /100 | #54 | Exceptional $95,673 |
| Immigrants | Czechoslovakia | 99.9 /100 | #55 | Exceptional $95,319 |
| Immigrants | Austria | 99.9 /100 | #56 | Exceptional $95,277 |
| New Zealanders | 99.8 /100 | #57 | Exceptional $95,146 |
| Soviet Union | 99.8 /100 | #58 | Exceptional $95,098 |
| Immigrants | Europe | 99.8 /100 | #59 | Exceptional $95,032 |
Demographics Similar to French Canadians by Median Household Income
In terms of median household income, the demographic groups most similar to French Canadians are Dutch ($82,971, a difference of 0.19%), Immigrants from Iraq ($82,594, a difference of 0.26%), Immigrants from Uruguay ($82,560, a difference of 0.30%), Immigrants from Kenya ($83,068, a difference of 0.31%), and Salvadoran ($82,449, a difference of 0.44%).
| Demographics | Rating | Rank | Median Household Income |
| Spanish | 24.4 /100 | #201 | Fair $83,343 |
| Immigrants | Thailand | 24.3 /100 | #202 | Fair $83,327 |
| Immigrants | Cambodia | 24.0 /100 | #203 | Fair $83,304 |
| Immigrants | Africa | 23.8 /100 | #204 | Fair $83,289 |
| Celtics | 22.7 /100 | #205 | Fair $83,193 |
| Immigrants | Kenya | 21.3 /100 | #206 | Fair $83,068 |
| Dutch | 20.3 /100 | #207 | Fair $82,971 |
| French Canadians | 18.7 /100 | #208 | Poor $82,810 |
| Immigrants | Iraq | 16.7 /100 | #209 | Poor $82,594 |
| Immigrants | Uruguay | 16.4 /100 | #210 | Poor $82,560 |
| Salvadorans | 15.4 /100 | #211 | Poor $82,449 |
| Venezuelans | 15.3 /100 | #212 | Poor $82,432 |
| Nepalese | 15.1 /100 | #213 | Poor $82,410 |
| Panamanians | 14.0 /100 | #214 | Poor $82,272 |
| Vietnamese | 13.8 /100 | #215 | Poor $82,248 |