Immigrants from Central America vs Polish Median Household Income
COMPARE
Immigrants from Central America
Polish
Median Household Income
Median Household Income Comparison
Immigrants from Central America
Poles
$74,217
MEDIAN HOUSEHOLD INCOME
0.1/ 100
METRIC RATING
288th/ 347
METRIC RANK
$88,472
MEDIAN HOUSEHOLD INCOME
89.7/ 100
METRIC RATING
136th/ 347
METRIC RANK
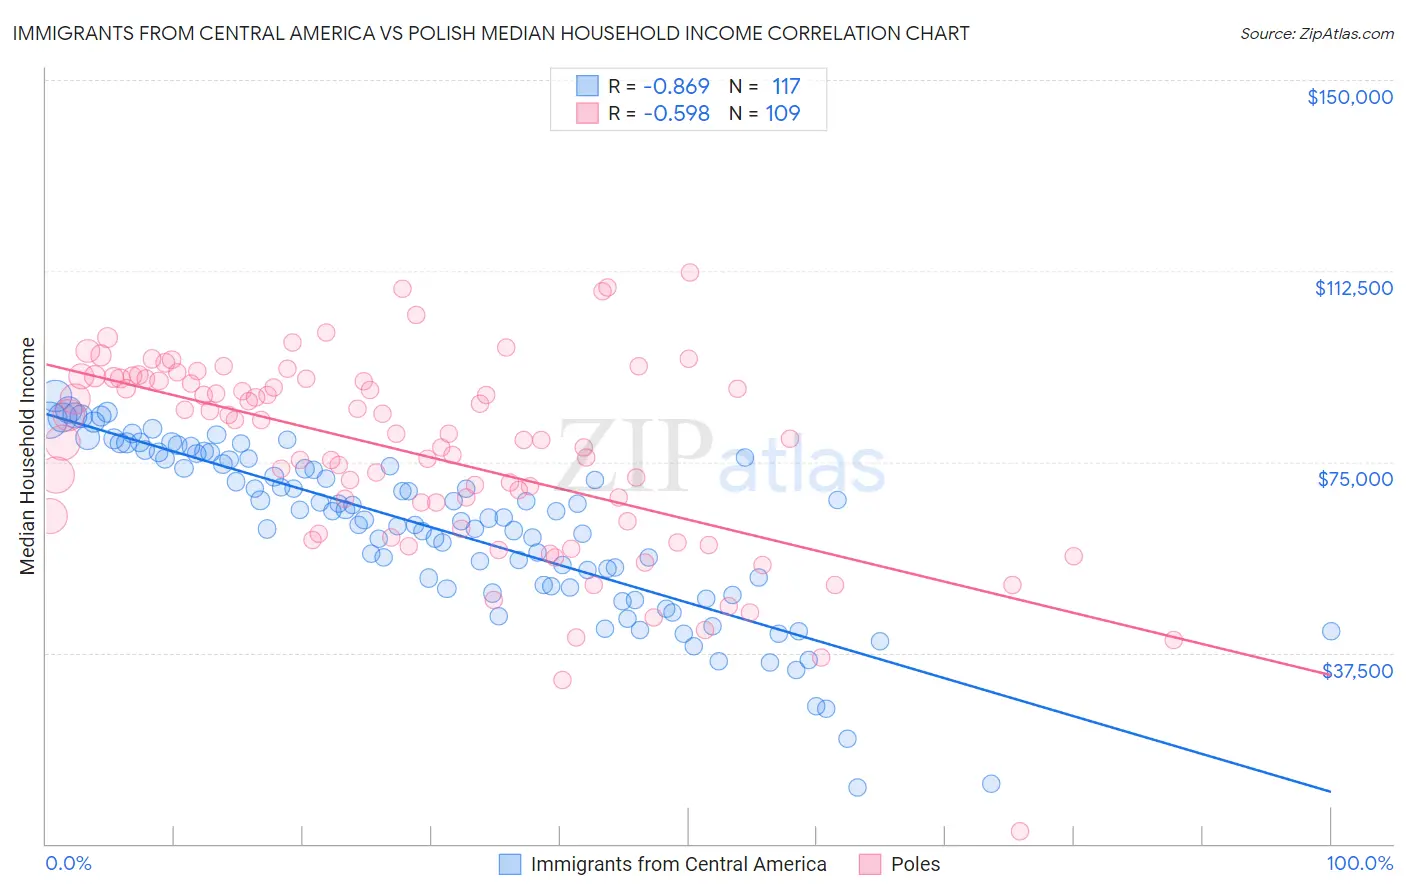
Immigrants from Central America vs Polish Median Household Income Correlation Chart
The statistical analysis conducted on geographies consisting of 535,748,911 people shows a very strong negative correlation between the proportion of Immigrants from Central America and median household income in the United States with a correlation coefficient (R) of -0.869 and weighted average of $74,217. Similarly, the statistical analysis conducted on geographies consisting of 559,571,407 people shows a substantial negative correlation between the proportion of Poles and median household income in the United States with a correlation coefficient (R) of -0.598 and weighted average of $88,472, a difference of 19.2%.
Median Household Income Correlation Summary
| Measurement | Immigrants from Central America | Polish |
| Minimum | $11,125 | $2,499 |
| Maximum | $87,880 | $112,083 |
| Range | $76,755 | $109,584 |
| Mean | $61,825 | $76,577 |
| Median | $64,116 | $79,444 |
| Interquartile 25% (IQ1) | $50,458 | $62,696 |
| Interquartile 75% (IQ3) | $75,695 | $91,347 |
| Interquartile Range (IQR) | $25,237 | $28,651 |
| Standard Deviation (Sample) | $16,428 | $19,210 |
| Standard Deviation (Population) | $16,358 | $19,121 |
Similar Demographics by Median Household Income
Demographics Similar to Immigrants from Central America by Median Household Income
In terms of median household income, the demographic groups most similar to Immigrants from Central America are Fijian ($74,205, a difference of 0.020%), Iroquois ($74,279, a difference of 0.080%), Immigrants from Somalia ($74,300, a difference of 0.11%), Bangladeshi ($74,112, a difference of 0.14%), and Mexican ($74,399, a difference of 0.24%).
| Demographics | Rating | Rank | Median Household Income |
| Immigrants | Liberia | 0.1 /100 | #281 | Tragic $74,896 |
| Central American Indians | 0.1 /100 | #282 | Tragic $74,847 |
| Cree | 0.1 /100 | #283 | Tragic $74,685 |
| Yaqui | 0.1 /100 | #284 | Tragic $74,596 |
| Mexicans | 0.1 /100 | #285 | Tragic $74,399 |
| Immigrants | Somalia | 0.1 /100 | #286 | Tragic $74,300 |
| Iroquois | 0.1 /100 | #287 | Tragic $74,279 |
| Immigrants | Central America | 0.1 /100 | #288 | Tragic $74,217 |
| Fijians | 0.1 /100 | #289 | Tragic $74,205 |
| Bangladeshis | 0.1 /100 | #290 | Tragic $74,112 |
| Hispanics or Latinos | 0.1 /100 | #291 | Tragic $73,823 |
| Comanche | 0.1 /100 | #292 | Tragic $73,747 |
| Immigrants | Cabo Verde | 0.1 /100 | #293 | Tragic $73,515 |
| Blackfeet | 0.1 /100 | #294 | Tragic $73,509 |
| Cubans | 0.1 /100 | #295 | Tragic $73,392 |
Demographics Similar to Poles by Median Household Income
In terms of median household income, the demographic groups most similar to Poles are Sierra Leonean ($88,463, a difference of 0.010%), Immigrants from Sierra Leone ($88,498, a difference of 0.030%), Swedish ($88,524, a difference of 0.060%), Arab ($88,398, a difference of 0.080%), and Immigrants from Chile ($88,388, a difference of 0.090%).
| Demographics | Rating | Rank | Median Household Income |
| Brazilians | 92.1 /100 | #129 | Exceptional $88,934 |
| British | 92.0 /100 | #130 | Exceptional $88,914 |
| Immigrants | Syria | 91.4 /100 | #131 | Exceptional $88,792 |
| Europeans | 91.2 /100 | #132 | Exceptional $88,751 |
| Immigrants | Ethiopia | 90.9 /100 | #133 | Exceptional $88,687 |
| Swedes | 90.0 /100 | #134 | Exceptional $88,524 |
| Immigrants | Sierra Leone | 89.9 /100 | #135 | Excellent $88,498 |
| Poles | 89.7 /100 | #136 | Excellent $88,472 |
| Sierra Leoneans | 89.6 /100 | #137 | Excellent $88,463 |
| Arabs | 89.2 /100 | #138 | Excellent $88,398 |
| Immigrants | Chile | 89.2 /100 | #139 | Excellent $88,388 |
| Lebanese | 87.2 /100 | #140 | Excellent $88,091 |
| Immigrants | Morocco | 86.0 /100 | #141 | Excellent $87,930 |
| Canadians | 84.7 /100 | #142 | Excellent $87,769 |
| Danes | 83.9 /100 | #143 | Excellent $87,676 |