Immigrants from Canada vs Delaware Householder Income Ages 45 - 64 years
COMPARE
Immigrants from Canada
Delaware
Householder Income Ages 45 - 64 years
Householder Income Ages 45 - 64 years Comparison
Immigrants from Canada
Delaware
$109,402
HOUSEHOLDER INCOME AGES 45 - 64 YEARS
99.0/ 100
METRIC RATING
78th/ 347
METRIC RANK
$94,914
HOUSEHOLDER INCOME AGES 45 - 64 YEARS
6.2/ 100
METRIC RATING
218th/ 347
METRIC RANK
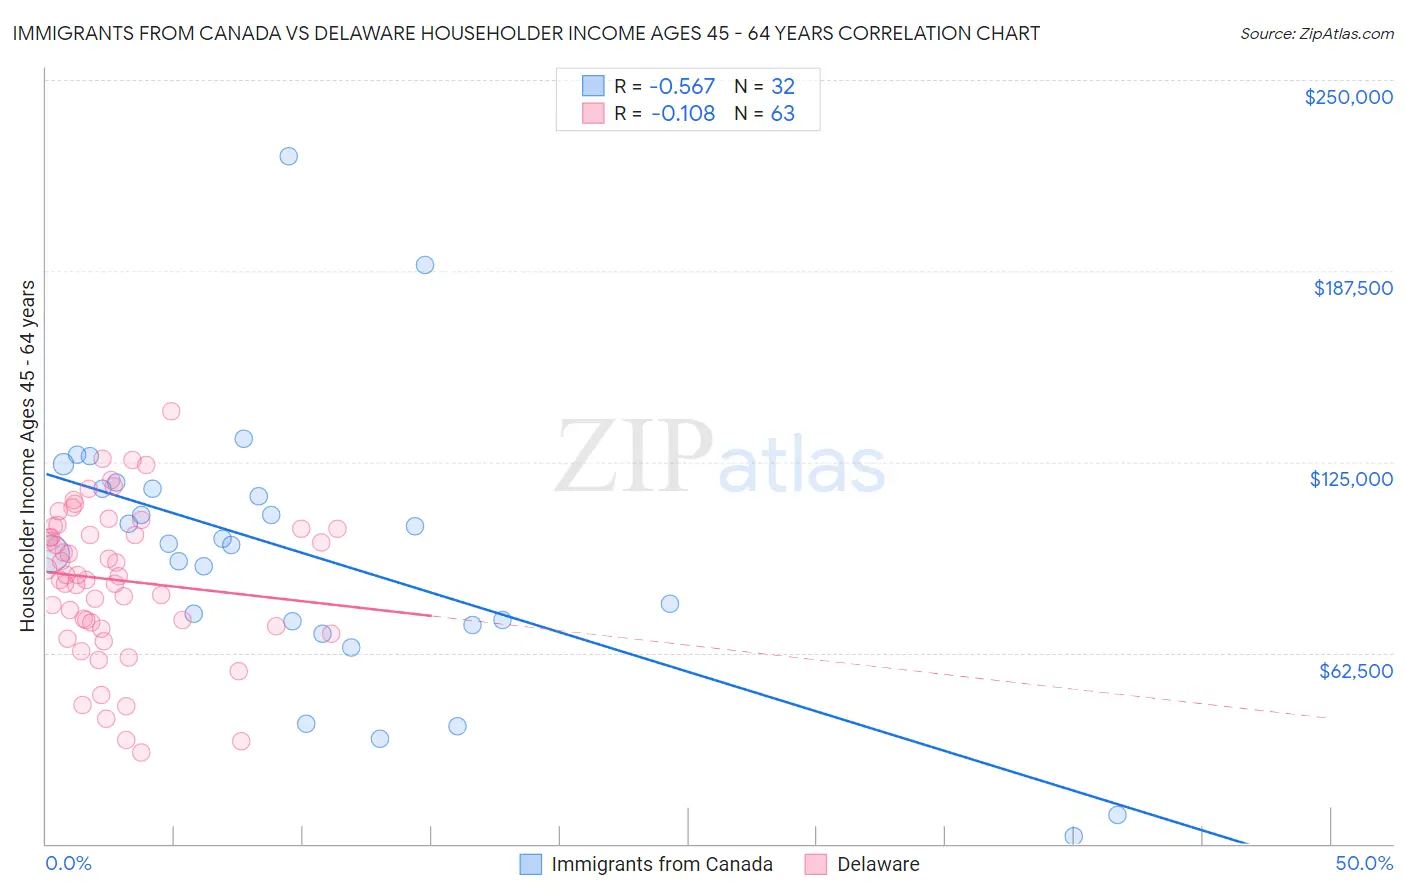
Immigrants from Canada vs Delaware Householder Income Ages 45 - 64 years Correlation Chart
The statistical analysis conducted on geographies consisting of 458,349,243 people shows a substantial negative correlation between the proportion of Immigrants from Canada and household income with householder between the ages 45 and 64 in the United States with a correlation coefficient (R) of -0.567 and weighted average of $109,402. Similarly, the statistical analysis conducted on geographies consisting of 96,163,125 people shows a poor negative correlation between the proportion of Delaware and household income with householder between the ages 45 and 64 in the United States with a correlation coefficient (R) of -0.108 and weighted average of $94,914, a difference of 15.3%.
Householder Income Ages 45 - 64 years Correlation Summary
| Measurement | Immigrants from Canada | Delaware |
| Minimum | $2,499 | $29,844 |
| Maximum | $225,000 | $141,667 |
| Range | $222,501 | $111,823 |
| Mean | $94,269 | $86,309 |
| Median | $97,921 | $87,768 |
| Interquartile 25% (IQ1) | $72,197 | $71,250 |
| Interquartile 75% (IQ3) | $116,180 | $103,023 |
| Interquartile Range (IQR) | $43,983 | $31,773 |
| Standard Deviation (Sample) | $44,787 | $24,513 |
| Standard Deviation (Population) | $44,082 | $24,318 |
Similar Demographics by Householder Income Ages 45 - 64 years
Demographics Similar to Immigrants from Canada by Householder Income Ages 45 - 64 years
In terms of householder income ages 45 - 64 years, the demographic groups most similar to Immigrants from Canada are Immigrants from Bulgaria ($109,379, a difference of 0.020%), Jordanian ($109,376, a difference of 0.020%), Paraguayan ($109,447, a difference of 0.040%), Immigrants from England ($109,446, a difference of 0.040%), and Immigrants from Eastern Europe ($109,335, a difference of 0.060%).
| Demographics | Rating | Rank | Householder Income Ages 45 - 64 years |
| Italians | 99.3 /100 | #71 | Exceptional $110,224 |
| Assyrians/Chaldeans/Syriacs | 99.3 /100 | #72 | Exceptional $110,201 |
| Argentineans | 99.3 /100 | #73 | Exceptional $110,103 |
| Immigrants | Egypt | 99.2 /100 | #74 | Exceptional $109,941 |
| South Africans | 99.1 /100 | #75 | Exceptional $109,719 |
| Paraguayans | 99.0 /100 | #76 | Exceptional $109,447 |
| Immigrants | England | 99.0 /100 | #77 | Exceptional $109,446 |
| Immigrants | Canada | 99.0 /100 | #78 | Exceptional $109,402 |
| Immigrants | Bulgaria | 98.9 /100 | #79 | Exceptional $109,379 |
| Jordanians | 98.9 /100 | #80 | Exceptional $109,376 |
| Immigrants | Eastern Europe | 98.9 /100 | #81 | Exceptional $109,335 |
| Immigrants | North America | 98.8 /100 | #82 | Exceptional $109,198 |
| Immigrants | Spain | 98.8 /100 | #83 | Exceptional $109,051 |
| Immigrants | Western Europe | 98.6 /100 | #84 | Exceptional $108,824 |
| Immigrants | Afghanistan | 98.6 /100 | #85 | Exceptional $108,785 |
Demographics Similar to Delaware by Householder Income Ages 45 - 64 years
In terms of householder income ages 45 - 64 years, the demographic groups most similar to Delaware are Immigrants from Armenia ($94,863, a difference of 0.050%), Immigrants from Ghana ($94,982, a difference of 0.070%), Salvadoran ($94,842, a difference of 0.080%), Immigrants from Nigeria ($94,804, a difference of 0.12%), and Malaysian ($94,517, a difference of 0.42%).
| Demographics | Rating | Rank | Householder Income Ages 45 - 64 years |
| Immigrants | Cambodia | 13.0 /100 | #211 | Poor $96,537 |
| Venezuelans | 12.6 /100 | #212 | Poor $96,460 |
| Immigrants | Uruguay | 10.7 /100 | #213 | Poor $96,086 |
| Panamanians | 10.6 /100 | #214 | Poor $96,066 |
| Nigerians | 8.2 /100 | #215 | Tragic $95,492 |
| Immigrants | Venezuela | 7.6 /100 | #216 | Tragic $95,342 |
| Immigrants | Ghana | 6.4 /100 | #217 | Tragic $94,982 |
| Delaware | 6.2 /100 | #218 | Tragic $94,914 |
| Immigrants | Armenia | 6.1 /100 | #219 | Tragic $94,863 |
| Salvadorans | 6.0 /100 | #220 | Tragic $94,842 |
| Immigrants | Nigeria | 5.9 /100 | #221 | Tragic $94,804 |
| Malaysians | 5.2 /100 | #222 | Tragic $94,517 |
| Immigrants | Nonimmigrants | 5.0 /100 | #223 | Tragic $94,448 |
| Immigrants | Bosnia and Herzegovina | 4.6 /100 | #224 | Tragic $94,288 |
| Bermudans | 4.4 /100 | #225 | Tragic $94,197 |