Immigrants from Canada vs Pennsylvania German Householder Income Ages 45 - 64 years
COMPARE
Immigrants from Canada
Pennsylvania German
Householder Income Ages 45 - 64 years
Householder Income Ages 45 - 64 years Comparison
Immigrants from Canada
Pennsylvania Germans
$109,402
HOUSEHOLDER INCOME AGES 45 - 64 YEARS
99.0/ 100
METRIC RATING
78th/ 347
METRIC RANK
$91,956
HOUSEHOLDER INCOME AGES 45 - 64 YEARS
1.5/ 100
METRIC RATING
238th/ 347
METRIC RANK
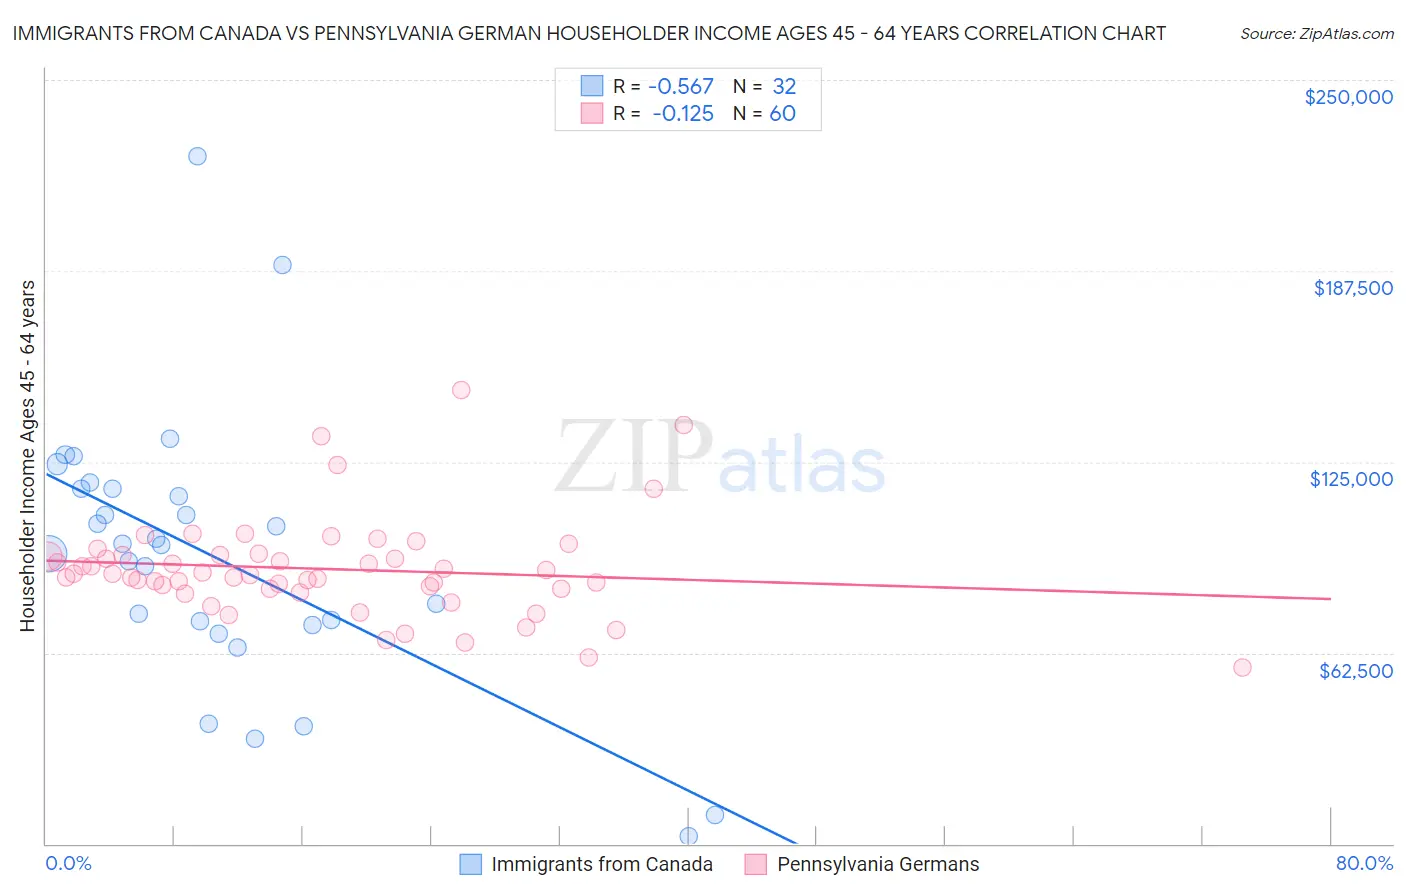
Immigrants from Canada vs Pennsylvania German Householder Income Ages 45 - 64 years Correlation Chart
The statistical analysis conducted on geographies consisting of 458,349,243 people shows a substantial negative correlation between the proportion of Immigrants from Canada and household income with householder between the ages 45 and 64 in the United States with a correlation coefficient (R) of -0.567 and weighted average of $109,402. Similarly, the statistical analysis conducted on geographies consisting of 233,806,042 people shows a poor negative correlation between the proportion of Pennsylvania Germans and household income with householder between the ages 45 and 64 in the United States with a correlation coefficient (R) of -0.125 and weighted average of $91,956, a difference of 19.0%.
Householder Income Ages 45 - 64 years Correlation Summary
| Measurement | Immigrants from Canada | Pennsylvania German |
| Minimum | $2,499 | $57,750 |
| Maximum | $225,000 | $148,333 |
| Range | $222,501 | $90,583 |
| Mean | $94,269 | $89,968 |
| Median | $97,921 | $88,175 |
| Interquartile 25% (IQ1) | $72,197 | $83,450 |
| Interquartile 75% (IQ3) | $116,180 | $94,494 |
| Interquartile Range (IQR) | $43,983 | $11,044 |
| Standard Deviation (Sample) | $44,787 | $16,415 |
| Standard Deviation (Population) | $44,082 | $16,277 |
Similar Demographics by Householder Income Ages 45 - 64 years
Demographics Similar to Immigrants from Canada by Householder Income Ages 45 - 64 years
In terms of householder income ages 45 - 64 years, the demographic groups most similar to Immigrants from Canada are Immigrants from Bulgaria ($109,379, a difference of 0.020%), Jordanian ($109,376, a difference of 0.020%), Paraguayan ($109,447, a difference of 0.040%), Immigrants from England ($109,446, a difference of 0.040%), and Immigrants from Eastern Europe ($109,335, a difference of 0.060%).
| Demographics | Rating | Rank | Householder Income Ages 45 - 64 years |
| Italians | 99.3 /100 | #71 | Exceptional $110,224 |
| Assyrians/Chaldeans/Syriacs | 99.3 /100 | #72 | Exceptional $110,201 |
| Argentineans | 99.3 /100 | #73 | Exceptional $110,103 |
| Immigrants | Egypt | 99.2 /100 | #74 | Exceptional $109,941 |
| South Africans | 99.1 /100 | #75 | Exceptional $109,719 |
| Paraguayans | 99.0 /100 | #76 | Exceptional $109,447 |
| Immigrants | England | 99.0 /100 | #77 | Exceptional $109,446 |
| Immigrants | Canada | 99.0 /100 | #78 | Exceptional $109,402 |
| Immigrants | Bulgaria | 98.9 /100 | #79 | Exceptional $109,379 |
| Jordanians | 98.9 /100 | #80 | Exceptional $109,376 |
| Immigrants | Eastern Europe | 98.9 /100 | #81 | Exceptional $109,335 |
| Immigrants | North America | 98.8 /100 | #82 | Exceptional $109,198 |
| Immigrants | Spain | 98.8 /100 | #83 | Exceptional $109,051 |
| Immigrants | Western Europe | 98.6 /100 | #84 | Exceptional $108,824 |
| Immigrants | Afghanistan | 98.6 /100 | #85 | Exceptional $108,785 |
Demographics Similar to Pennsylvania Germans by Householder Income Ages 45 - 64 years
In terms of householder income ages 45 - 64 years, the demographic groups most similar to Pennsylvania Germans are Immigrants from Bangladesh ($92,208, a difference of 0.27%), Immigrants from Western Africa ($92,384, a difference of 0.46%), Immigrants from Ecuador ($91,462, a difference of 0.54%), Immigrants from Burma/Myanmar ($91,385, a difference of 0.63%), and Nicaraguan ($92,554, a difference of 0.65%).
| Demographics | Rating | Rank | Householder Income Ages 45 - 64 years |
| Ecuadorians | 3.6 /100 | #231 | Tragic $93,739 |
| Sudanese | 3.5 /100 | #232 | Tragic $93,718 |
| Nepalese | 3.0 /100 | #233 | Tragic $93,355 |
| Immigrants | El Salvador | 2.7 /100 | #234 | Tragic $93,176 |
| Nicaraguans | 2.0 /100 | #235 | Tragic $92,554 |
| Immigrants | Western Africa | 1.8 /100 | #236 | Tragic $92,384 |
| Immigrants | Bangladesh | 1.7 /100 | #237 | Tragic $92,208 |
| Pennsylvania Germans | 1.5 /100 | #238 | Tragic $91,956 |
| Immigrants | Ecuador | 1.2 /100 | #239 | Tragic $91,462 |
| Immigrants | Burma/Myanmar | 1.1 /100 | #240 | Tragic $91,385 |
| Trinidadians and Tobagonians | 1.1 /100 | #241 | Tragic $91,357 |
| Inupiat | 1.1 /100 | #242 | Tragic $91,355 |
| Immigrants | Trinidad and Tobago | 1.1 /100 | #243 | Tragic $91,347 |
| Immigrants | Middle Africa | 1.1 /100 | #244 | Tragic $91,293 |
| Guyanese | 0.9 /100 | #245 | Tragic $90,966 |