Immigrants from Canada vs Delaware In Labor Force | Age 35-44
COMPARE
Immigrants from Canada
Delaware
In Labor Force | Age 35-44
In Labor Force | Age 35-44 Comparison
Immigrants from Canada
Delaware
84.2%
IN LABOR FORCE | AGE 35-44
19.6/ 100
METRIC RATING
205th/ 347
METRIC RANK
83.2%
IN LABOR FORCE | AGE 35-44
0.0/ 100
METRIC RATING
276th/ 347
METRIC RANK
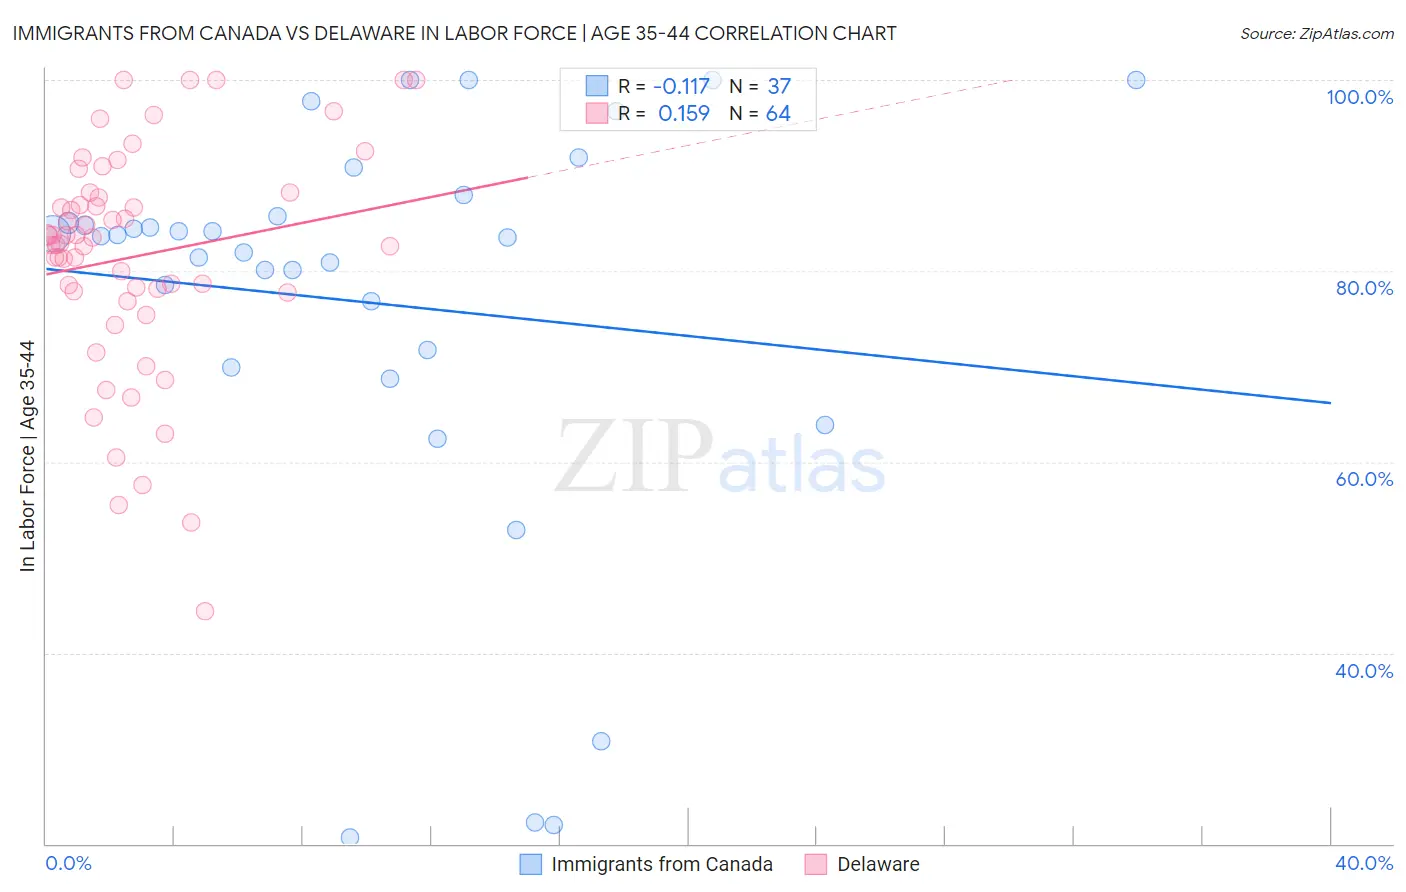
Immigrants from Canada vs Delaware In Labor Force | Age 35-44 Correlation Chart
The statistical analysis conducted on geographies consisting of 459,143,977 people shows a poor negative correlation between the proportion of Immigrants from Canada and labor force participation rate among population between the ages 35 and 44 in the United States with a correlation coefficient (R) of -0.117 and weighted average of 84.2%. Similarly, the statistical analysis conducted on geographies consisting of 96,216,045 people shows a poor positive correlation between the proportion of Delaware and labor force participation rate among population between the ages 35 and 44 in the United States with a correlation coefficient (R) of 0.159 and weighted average of 83.2%, a difference of 1.2%.
In Labor Force | Age 35-44 Correlation Summary
| Measurement | Immigrants from Canada | Delaware |
| Minimum | 20.7% | 44.4% |
| Maximum | 100.0% | 100.0% |
| Range | 79.3% | 55.6% |
| Mean | 76.7% | 81.5% |
| Median | 83.6% | 83.2% |
| Interquartile 25% (IQ1) | 70.8% | 77.8% |
| Interquartile 75% (IQ3) | 86.8% | 87.9% |
| Interquartile Range (IQR) | 16.0% | 10.1% |
| Standard Deviation (Sample) | 21.5% | 11.8% |
| Standard Deviation (Population) | 21.2% | 11.8% |
Similar Demographics by In Labor Force | Age 35-44
Demographics Similar to Immigrants from Canada by In Labor Force | Age 35-44
In terms of in labor force | age 35-44, the demographic groups most similar to Immigrants from Canada are Canadian (84.2%, a difference of 0.0%), Immigrants from Costa Rica (84.2%, a difference of 0.0%), Laotian (84.2%, a difference of 0.010%), Immigrants from North America (84.2%, a difference of 0.020%), and Swiss (84.2%, a difference of 0.020%).
| Demographics | Rating | Rank | In Labor Force | Age 35-44 |
| Ecuadorians | 24.0 /100 | #198 | Fair 84.2% |
| Syrians | 23.2 /100 | #199 | Fair 84.2% |
| Moroccans | 23.2 /100 | #200 | Fair 84.2% |
| British | 23.0 /100 | #201 | Fair 84.2% |
| Immigrants | Uzbekistan | 22.8 /100 | #202 | Fair 84.2% |
| Immigrants | South Eastern Asia | 22.4 /100 | #203 | Fair 84.2% |
| Canadians | 19.9 /100 | #204 | Poor 84.2% |
| Immigrants | Canada | 19.6 /100 | #205 | Poor 84.2% |
| Immigrants | Costa Rica | 19.5 /100 | #206 | Poor 84.2% |
| Laotians | 19.0 /100 | #207 | Poor 84.2% |
| Immigrants | North America | 18.1 /100 | #208 | Poor 84.2% |
| Swiss | 17.4 /100 | #209 | Poor 84.2% |
| New Zealanders | 16.2 /100 | #210 | Poor 84.1% |
| Immigrants | Ecuador | 15.2 /100 | #211 | Poor 84.1% |
| Israelis | 14.0 /100 | #212 | Poor 84.1% |
Demographics Similar to Delaware by In Labor Force | Age 35-44
In terms of in labor force | age 35-44, the demographic groups most similar to Delaware are Hawaiian (83.2%, a difference of 0.010%), Samoan (83.2%, a difference of 0.010%), Nonimmigrants (83.2%, a difference of 0.030%), Immigrants from Fiji (83.2%, a difference of 0.040%), and Spanish (83.2%, a difference of 0.040%).
| Demographics | Rating | Rank | In Labor Force | Age 35-44 |
| Immigrants | Grenada | 0.1 /100 | #269 | Tragic 83.3% |
| Immigrants | Honduras | 0.0 /100 | #270 | Tragic 83.3% |
| French American Indians | 0.0 /100 | #271 | Tragic 83.2% |
| Immigrants | Fiji | 0.0 /100 | #272 | Tragic 83.2% |
| Spanish | 0.0 /100 | #273 | Tragic 83.2% |
| Immigrants | Nonimmigrants | 0.0 /100 | #274 | Tragic 83.2% |
| Hawaiians | 0.0 /100 | #275 | Tragic 83.2% |
| Delaware | 0.0 /100 | #276 | Tragic 83.2% |
| Samoans | 0.0 /100 | #277 | Tragic 83.2% |
| Belizeans | 0.0 /100 | #278 | Tragic 83.1% |
| Immigrants | Micronesia | 0.0 /100 | #279 | Tragic 83.1% |
| Dominicans | 0.0 /100 | #280 | Tragic 83.1% |
| Guatemalans | 0.0 /100 | #281 | Tragic 83.0% |
| Osage | 0.0 /100 | #282 | Tragic 82.9% |
| Immigrants | Guatemala | 0.0 /100 | #283 | Tragic 82.9% |