Swiss vs Delaware Householder Income Ages 45 - 64 years
COMPARE
Swiss
Delaware
Householder Income Ages 45 - 64 years
Householder Income Ages 45 - 64 years Comparison
Swiss
Delaware
$103,071
HOUSEHOLDER INCOME AGES 45 - 64 YEARS
79.9/ 100
METRIC RATING
151st/ 347
METRIC RANK
$94,914
HOUSEHOLDER INCOME AGES 45 - 64 YEARS
6.2/ 100
METRIC RATING
218th/ 347
METRIC RANK
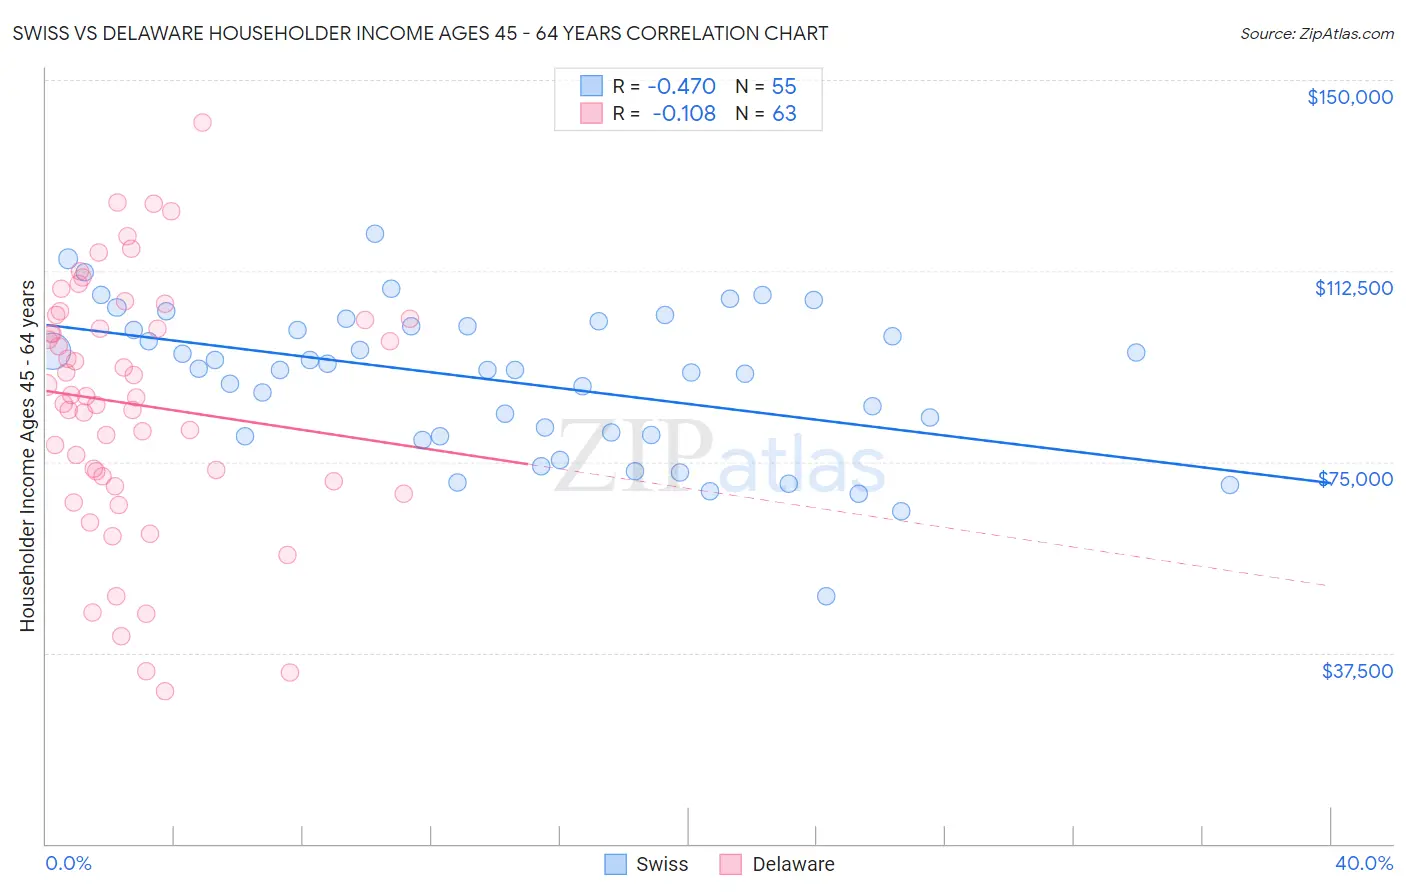
Swiss vs Delaware Householder Income Ages 45 - 64 years Correlation Chart
The statistical analysis conducted on geographies consisting of 463,835,295 people shows a moderate negative correlation between the proportion of Swiss and household income with householder between the ages 45 and 64 in the United States with a correlation coefficient (R) of -0.470 and weighted average of $103,071. Similarly, the statistical analysis conducted on geographies consisting of 96,163,125 people shows a poor negative correlation between the proportion of Delaware and household income with householder between the ages 45 and 64 in the United States with a correlation coefficient (R) of -0.108 and weighted average of $94,914, a difference of 8.6%.
Householder Income Ages 45 - 64 years Correlation Summary
| Measurement | Swiss | Delaware |
| Minimum | $48,631 | $29,844 |
| Maximum | $119,830 | $141,667 |
| Range | $71,199 | $111,823 |
| Mean | $90,919 | $86,309 |
| Median | $93,146 | $87,768 |
| Interquartile 25% (IQ1) | $80,104 | $71,250 |
| Interquartile 75% (IQ3) | $101,628 | $103,023 |
| Interquartile Range (IQR) | $21,524 | $31,773 |
| Standard Deviation (Sample) | $14,599 | $24,513 |
| Standard Deviation (Population) | $14,465 | $24,318 |
Similar Demographics by Householder Income Ages 45 - 64 years
Demographics Similar to Swiss by Householder Income Ages 45 - 64 years
In terms of householder income ages 45 - 64 years, the demographic groups most similar to Swiss are Irish ($103,067, a difference of 0.0%), Immigrants from Peru ($103,173, a difference of 0.10%), Scandinavian ($102,969, a difference of 0.10%), Immigrants from Sierra Leone ($103,227, a difference of 0.15%), and Slovene ($102,885, a difference of 0.18%).
| Demographics | Rating | Rank | Householder Income Ages 45 - 64 years |
| Czechs | 83.1 /100 | #144 | Excellent $103,507 |
| Ugandans | 82.9 /100 | #145 | Excellent $103,472 |
| Immigrants | Chile | 82.5 /100 | #146 | Excellent $103,412 |
| Basques | 82.3 /100 | #147 | Excellent $103,387 |
| Immigrants | Germany | 81.5 /100 | #148 | Excellent $103,282 |
| Immigrants | Sierra Leone | 81.1 /100 | #149 | Excellent $103,227 |
| Immigrants | Peru | 80.7 /100 | #150 | Excellent $103,173 |
| Swiss | 79.9 /100 | #151 | Good $103,071 |
| Irish | 79.8 /100 | #152 | Good $103,067 |
| Scandinavians | 79.0 /100 | #153 | Good $102,969 |
| Slovenes | 78.3 /100 | #154 | Good $102,885 |
| Costa Ricans | 77.4 /100 | #155 | Good $102,779 |
| Carpatho Rusyns | 77.4 /100 | #156 | Good $102,777 |
| Immigrants | Ethiopia | 77.3 /100 | #157 | Good $102,763 |
| Slavs | 76.1 /100 | #158 | Good $102,629 |
Demographics Similar to Delaware by Householder Income Ages 45 - 64 years
In terms of householder income ages 45 - 64 years, the demographic groups most similar to Delaware are Immigrants from Armenia ($94,863, a difference of 0.050%), Immigrants from Ghana ($94,982, a difference of 0.070%), Salvadoran ($94,842, a difference of 0.080%), Immigrants from Nigeria ($94,804, a difference of 0.12%), and Malaysian ($94,517, a difference of 0.42%).
| Demographics | Rating | Rank | Householder Income Ages 45 - 64 years |
| Immigrants | Cambodia | 13.0 /100 | #211 | Poor $96,537 |
| Venezuelans | 12.6 /100 | #212 | Poor $96,460 |
| Immigrants | Uruguay | 10.7 /100 | #213 | Poor $96,086 |
| Panamanians | 10.6 /100 | #214 | Poor $96,066 |
| Nigerians | 8.2 /100 | #215 | Tragic $95,492 |
| Immigrants | Venezuela | 7.6 /100 | #216 | Tragic $95,342 |
| Immigrants | Ghana | 6.4 /100 | #217 | Tragic $94,982 |
| Delaware | 6.2 /100 | #218 | Tragic $94,914 |
| Immigrants | Armenia | 6.1 /100 | #219 | Tragic $94,863 |
| Salvadorans | 6.0 /100 | #220 | Tragic $94,842 |
| Immigrants | Nigeria | 5.9 /100 | #221 | Tragic $94,804 |
| Malaysians | 5.2 /100 | #222 | Tragic $94,517 |
| Immigrants | Nonimmigrants | 5.0 /100 | #223 | Tragic $94,448 |
| Immigrants | Bosnia and Herzegovina | 4.6 /100 | #224 | Tragic $94,288 |
| Bermudans | 4.4 /100 | #225 | Tragic $94,197 |