Immigrants from Uzbekistan vs Delaware Householder Income Ages 45 - 64 years
COMPARE
Immigrants from Uzbekistan
Delaware
Householder Income Ages 45 - 64 years
Householder Income Ages 45 - 64 years Comparison
Immigrants from Uzbekistan
Delaware
$100,523
HOUSEHOLDER INCOME AGES 45 - 64 YEARS
52.5/ 100
METRIC RATING
172nd/ 347
METRIC RANK
$94,914
HOUSEHOLDER INCOME AGES 45 - 64 YEARS
6.2/ 100
METRIC RATING
218th/ 347
METRIC RANK
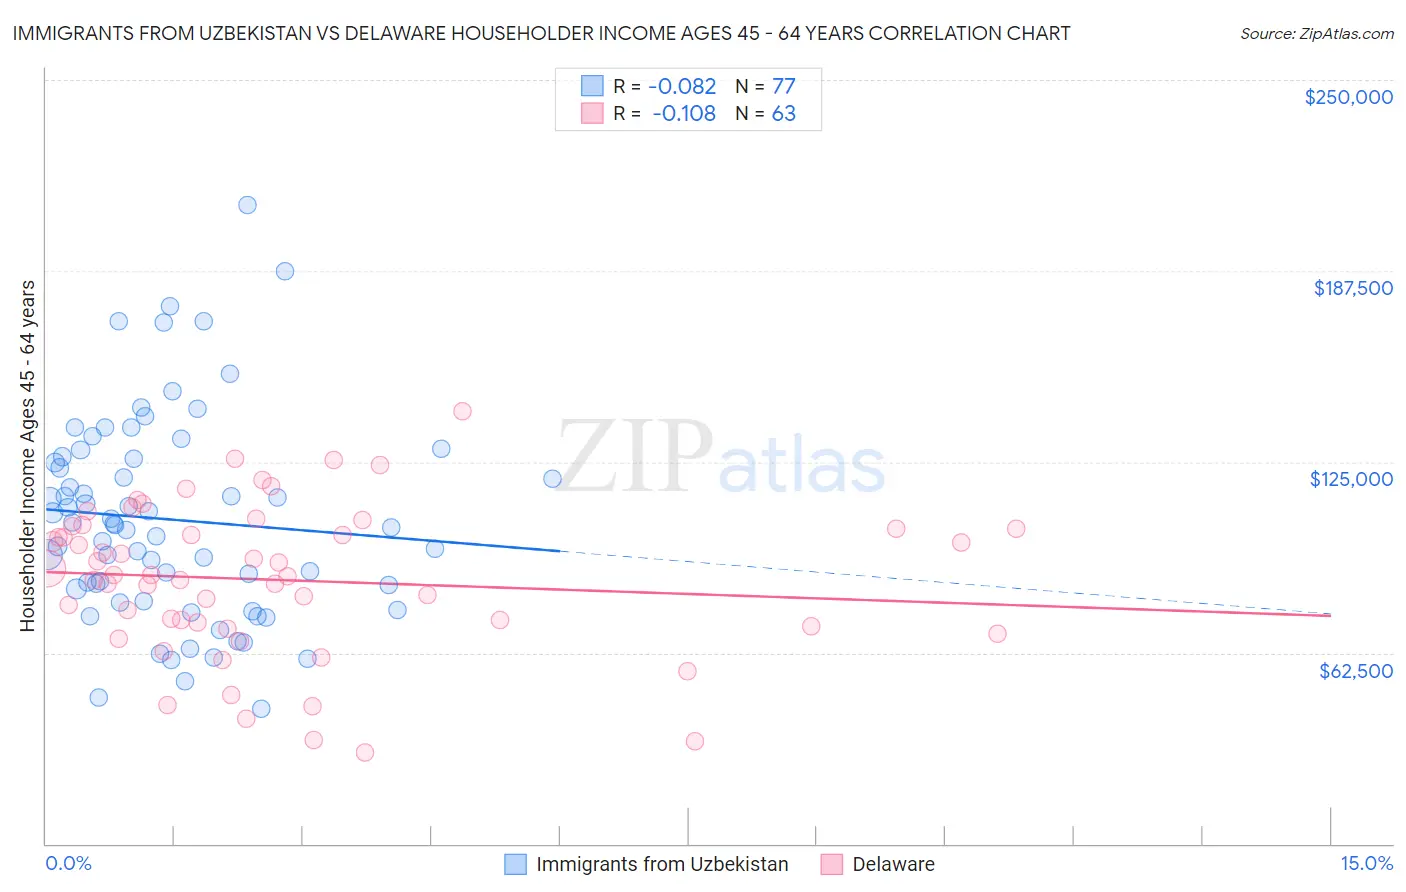
Immigrants from Uzbekistan vs Delaware Householder Income Ages 45 - 64 years Correlation Chart
The statistical analysis conducted on geographies consisting of 118,644,121 people shows a slight negative correlation between the proportion of Immigrants from Uzbekistan and household income with householder between the ages 45 and 64 in the United States with a correlation coefficient (R) of -0.082 and weighted average of $100,523. Similarly, the statistical analysis conducted on geographies consisting of 96,163,125 people shows a poor negative correlation between the proportion of Delaware and household income with householder between the ages 45 and 64 in the United States with a correlation coefficient (R) of -0.108 and weighted average of $94,914, a difference of 5.9%.
Householder Income Ages 45 - 64 years Correlation Summary
| Measurement | Immigrants from Uzbekistan | Delaware |
| Minimum | $44,028 | $29,844 |
| Maximum | $209,232 | $141,667 |
| Range | $165,204 | $111,823 |
| Mean | $106,089 | $86,309 |
| Median | $104,321 | $87,768 |
| Interquartile 25% (IQ1) | $81,393 | $71,250 |
| Interquartile 75% (IQ3) | $126,326 | $103,023 |
| Interquartile Range (IQR) | $44,934 | $31,773 |
| Standard Deviation (Sample) | $33,612 | $24,513 |
| Standard Deviation (Population) | $33,393 | $24,318 |
Similar Demographics by Householder Income Ages 45 - 64 years
Demographics Similar to Immigrants from Uzbekistan by Householder Income Ages 45 - 64 years
In terms of householder income ages 45 - 64 years, the demographic groups most similar to Immigrants from Uzbekistan are Alsatian ($100,435, a difference of 0.090%), Welsh ($100,322, a difference of 0.20%), German ($100,224, a difference of 0.30%), South American ($100,837, a difference of 0.31%), and Immigrants from Costa Rica ($100,141, a difference of 0.38%).
| Demographics | Rating | Rank | Householder Income Ages 45 - 64 years |
| Immigrants | Albania | 69.4 /100 | #165 | Good $101,957 |
| Samoans | 65.3 /100 | #166 | Good $101,580 |
| Czechoslovakians | 63.0 /100 | #167 | Good $101,387 |
| South American Indians | 60.5 /100 | #168 | Good $101,171 |
| Guamanians/Chamorros | 60.5 /100 | #169 | Good $101,170 |
| Slovaks | 58.8 /100 | #170 | Average $101,029 |
| South Americans | 56.4 /100 | #171 | Average $100,837 |
| Immigrants | Uzbekistan | 52.5 /100 | #172 | Average $100,523 |
| Alsatians | 51.4 /100 | #173 | Average $100,435 |
| Welsh | 50.0 /100 | #174 | Average $100,322 |
| Germans | 48.8 /100 | #175 | Average $100,224 |
| Immigrants | Costa Rica | 47.7 /100 | #176 | Average $100,141 |
| Moroccans | 47.7 /100 | #177 | Average $100,138 |
| Immigrants | Cameroon | 47.0 /100 | #178 | Average $100,084 |
| Belgians | 46.7 /100 | #179 | Average $100,060 |
Demographics Similar to Delaware by Householder Income Ages 45 - 64 years
In terms of householder income ages 45 - 64 years, the demographic groups most similar to Delaware are Immigrants from Armenia ($94,863, a difference of 0.050%), Immigrants from Ghana ($94,982, a difference of 0.070%), Salvadoran ($94,842, a difference of 0.080%), Immigrants from Nigeria ($94,804, a difference of 0.12%), and Malaysian ($94,517, a difference of 0.42%).
| Demographics | Rating | Rank | Householder Income Ages 45 - 64 years |
| Immigrants | Cambodia | 13.0 /100 | #211 | Poor $96,537 |
| Venezuelans | 12.6 /100 | #212 | Poor $96,460 |
| Immigrants | Uruguay | 10.7 /100 | #213 | Poor $96,086 |
| Panamanians | 10.6 /100 | #214 | Poor $96,066 |
| Nigerians | 8.2 /100 | #215 | Tragic $95,492 |
| Immigrants | Venezuela | 7.6 /100 | #216 | Tragic $95,342 |
| Immigrants | Ghana | 6.4 /100 | #217 | Tragic $94,982 |
| Delaware | 6.2 /100 | #218 | Tragic $94,914 |
| Immigrants | Armenia | 6.1 /100 | #219 | Tragic $94,863 |
| Salvadorans | 6.0 /100 | #220 | Tragic $94,842 |
| Immigrants | Nigeria | 5.9 /100 | #221 | Tragic $94,804 |
| Malaysians | 5.2 /100 | #222 | Tragic $94,517 |
| Immigrants | Nonimmigrants | 5.0 /100 | #223 | Tragic $94,448 |
| Immigrants | Bosnia and Herzegovina | 4.6 /100 | #224 | Tragic $94,288 |
| Bermudans | 4.4 /100 | #225 | Tragic $94,197 |