Immigrants from Canada vs Indian (Asian) Householder Income Ages 45 - 64 years
COMPARE
Immigrants from Canada
Indian (Asian)
Householder Income Ages 45 - 64 years
Householder Income Ages 45 - 64 years Comparison
Immigrants from Canada
Indians (Asian)
$109,402
HOUSEHOLDER INCOME AGES 45 - 64 YEARS
99.0/ 100
METRIC RATING
78th/ 347
METRIC RANK
$122,343
HOUSEHOLDER INCOME AGES 45 - 64 YEARS
100.0/ 100
METRIC RATING
14th/ 347
METRIC RANK
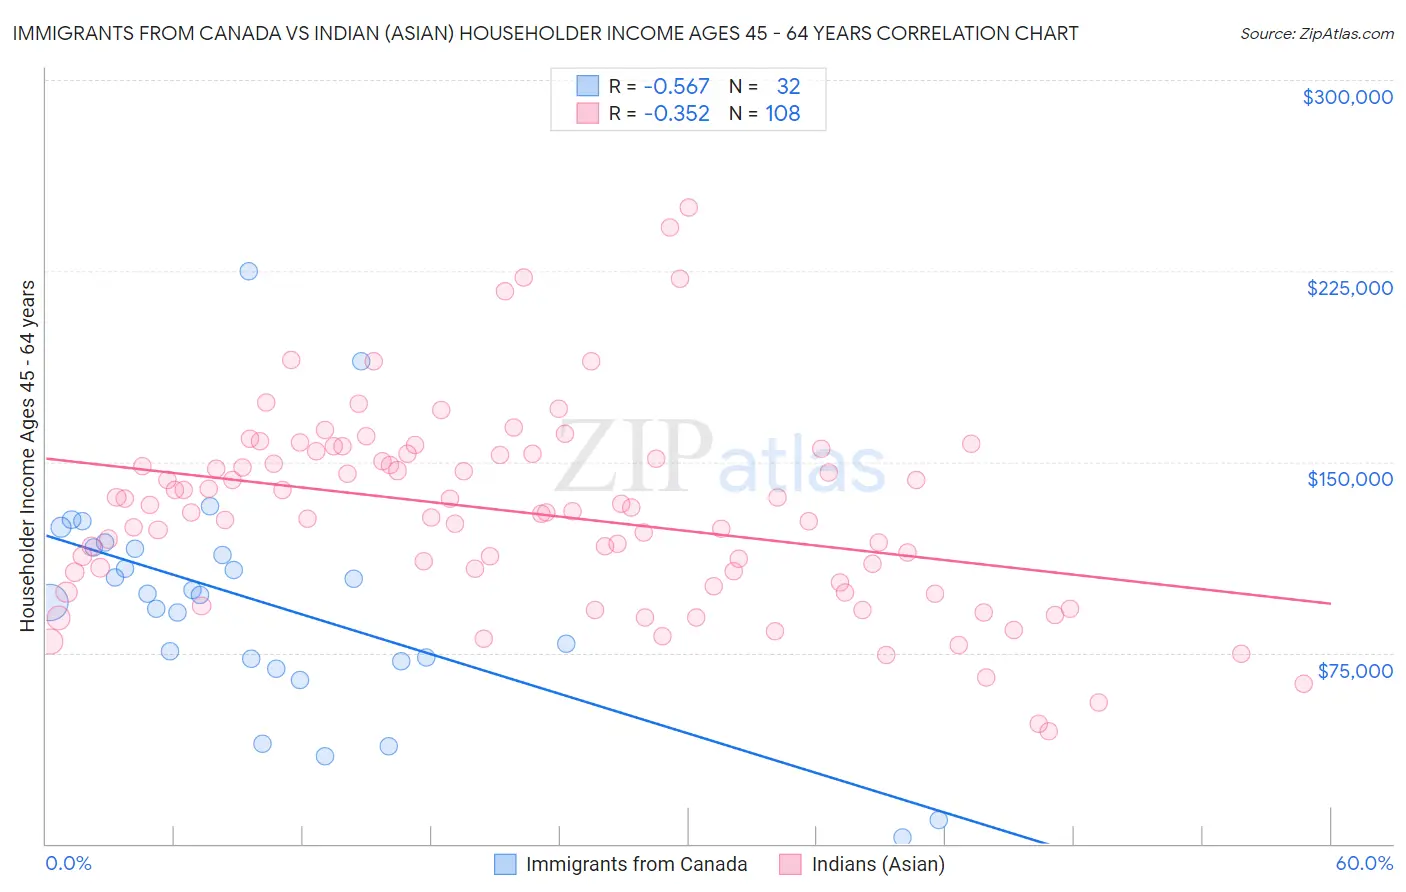
Immigrants from Canada vs Indian (Asian) Householder Income Ages 45 - 64 years Correlation Chart
The statistical analysis conducted on geographies consisting of 458,349,243 people shows a substantial negative correlation between the proportion of Immigrants from Canada and household income with householder between the ages 45 and 64 in the United States with a correlation coefficient (R) of -0.567 and weighted average of $109,402. Similarly, the statistical analysis conducted on geographies consisting of 493,767,636 people shows a mild negative correlation between the proportion of Indians (Asian) and household income with householder between the ages 45 and 64 in the United States with a correlation coefficient (R) of -0.352 and weighted average of $122,343, a difference of 11.8%.
Householder Income Ages 45 - 64 years Correlation Summary
| Measurement | Immigrants from Canada | Indian (Asian) |
| Minimum | $2,499 | $44,167 |
| Maximum | $225,000 | $250,001 |
| Range | $222,501 | $205,834 |
| Mean | $94,269 | $130,085 |
| Median | $97,921 | $130,239 |
| Interquartile 25% (IQ1) | $72,197 | $104,628 |
| Interquartile 75% (IQ3) | $116,180 | $152,944 |
| Interquartile Range (IQR) | $43,983 | $48,316 |
| Standard Deviation (Sample) | $44,787 | $38,442 |
| Standard Deviation (Population) | $44,082 | $38,264 |
Similar Demographics by Householder Income Ages 45 - 64 years
Demographics Similar to Immigrants from Canada by Householder Income Ages 45 - 64 years
In terms of householder income ages 45 - 64 years, the demographic groups most similar to Immigrants from Canada are Immigrants from Bulgaria ($109,379, a difference of 0.020%), Jordanian ($109,376, a difference of 0.020%), Paraguayan ($109,447, a difference of 0.040%), Immigrants from England ($109,446, a difference of 0.040%), and Immigrants from Eastern Europe ($109,335, a difference of 0.060%).
| Demographics | Rating | Rank | Householder Income Ages 45 - 64 years |
| Italians | 99.3 /100 | #71 | Exceptional $110,224 |
| Assyrians/Chaldeans/Syriacs | 99.3 /100 | #72 | Exceptional $110,201 |
| Argentineans | 99.3 /100 | #73 | Exceptional $110,103 |
| Immigrants | Egypt | 99.2 /100 | #74 | Exceptional $109,941 |
| South Africans | 99.1 /100 | #75 | Exceptional $109,719 |
| Paraguayans | 99.0 /100 | #76 | Exceptional $109,447 |
| Immigrants | England | 99.0 /100 | #77 | Exceptional $109,446 |
| Immigrants | Canada | 99.0 /100 | #78 | Exceptional $109,402 |
| Immigrants | Bulgaria | 98.9 /100 | #79 | Exceptional $109,379 |
| Jordanians | 98.9 /100 | #80 | Exceptional $109,376 |
| Immigrants | Eastern Europe | 98.9 /100 | #81 | Exceptional $109,335 |
| Immigrants | North America | 98.8 /100 | #82 | Exceptional $109,198 |
| Immigrants | Spain | 98.8 /100 | #83 | Exceptional $109,051 |
| Immigrants | Western Europe | 98.6 /100 | #84 | Exceptional $108,824 |
| Immigrants | Afghanistan | 98.6 /100 | #85 | Exceptional $108,785 |
Demographics Similar to Indians (Asian) by Householder Income Ages 45 - 64 years
In terms of householder income ages 45 - 64 years, the demographic groups most similar to Indians (Asian) are Immigrants from Eastern Asia ($122,222, a difference of 0.10%), Immigrants from China ($122,178, a difference of 0.14%), Immigrants from Ireland ($122,757, a difference of 0.34%), Immigrants from Israel ($122,893, a difference of 0.45%), and Burmese ($121,444, a difference of 0.74%).
| Demographics | Rating | Rank | Householder Income Ages 45 - 64 years |
| Immigrants | Hong Kong | 100.0 /100 | #7 | Exceptional $127,500 |
| Immigrants | Iran | 100.0 /100 | #8 | Exceptional $126,940 |
| Okinawans | 100.0 /100 | #9 | Exceptional $124,796 |
| Immigrants | South Central Asia | 100.0 /100 | #10 | Exceptional $124,188 |
| Cypriots | 100.0 /100 | #11 | Exceptional $123,396 |
| Immigrants | Israel | 100.0 /100 | #12 | Exceptional $122,893 |
| Immigrants | Ireland | 100.0 /100 | #13 | Exceptional $122,757 |
| Indians (Asian) | 100.0 /100 | #14 | Exceptional $122,343 |
| Immigrants | Eastern Asia | 100.0 /100 | #15 | Exceptional $122,222 |
| Immigrants | China | 100.0 /100 | #16 | Exceptional $122,178 |
| Burmese | 100.0 /100 | #17 | Exceptional $121,444 |
| Immigrants | Korea | 100.0 /100 | #18 | Exceptional $121,243 |
| Eastern Europeans | 100.0 /100 | #19 | Exceptional $120,684 |
| Immigrants | Australia | 100.0 /100 | #20 | Exceptional $119,308 |
| Immigrants | Sri Lanka | 100.0 /100 | #21 | Exceptional $119,094 |