Immigrants from Western Africa vs Delaware Householder Income Ages 45 - 64 years
COMPARE
Immigrants from Western Africa
Delaware
Householder Income Ages 45 - 64 years
Householder Income Ages 45 - 64 years Comparison
Immigrants from Western Africa
Delaware
$92,384
HOUSEHOLDER INCOME AGES 45 - 64 YEARS
1.8/ 100
METRIC RATING
236th/ 347
METRIC RANK
$94,914
HOUSEHOLDER INCOME AGES 45 - 64 YEARS
6.2/ 100
METRIC RATING
218th/ 347
METRIC RANK
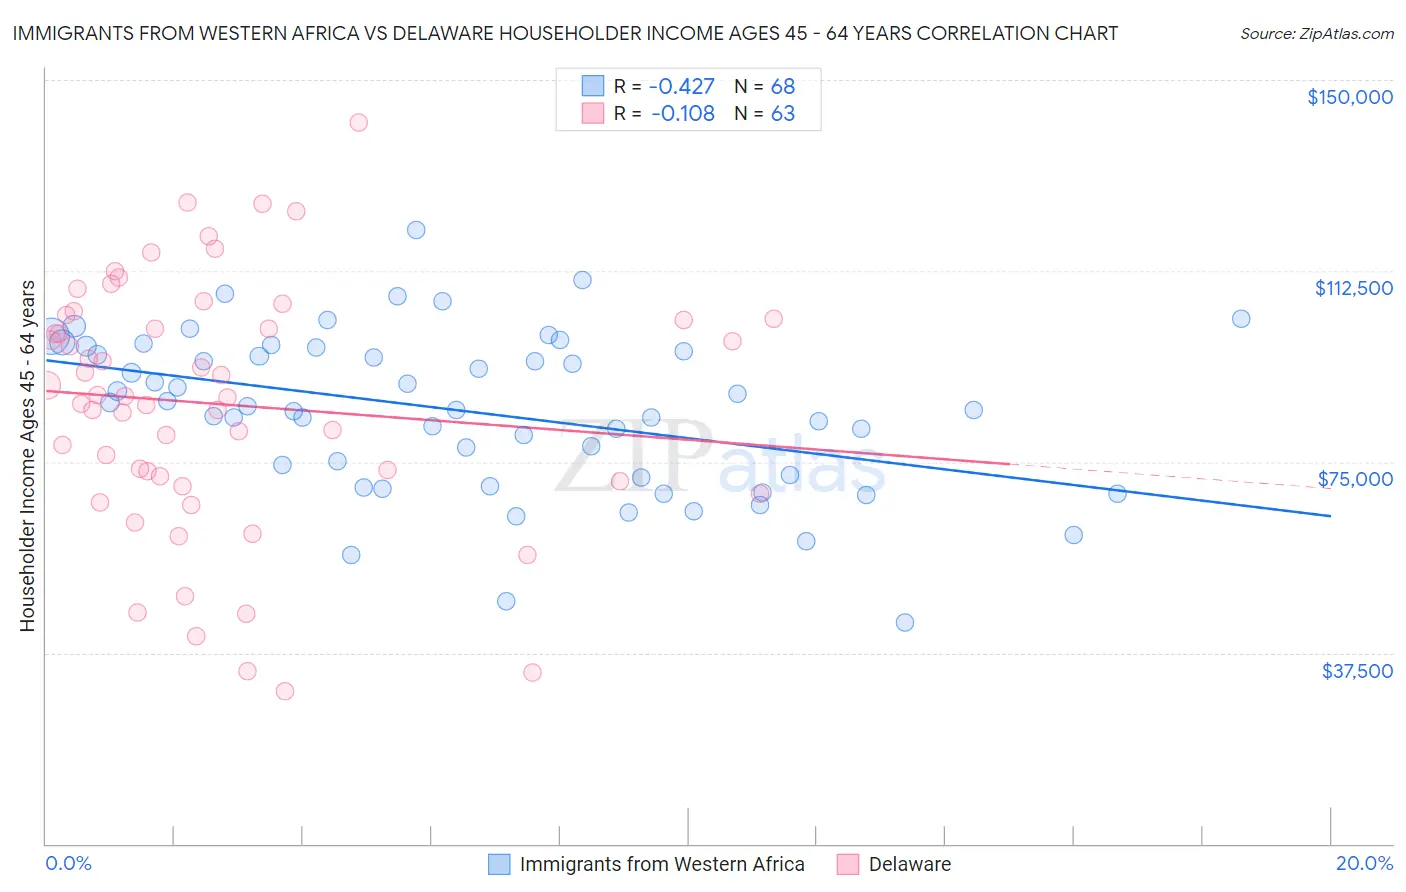
Immigrants from Western Africa vs Delaware Householder Income Ages 45 - 64 years Correlation Chart
The statistical analysis conducted on geographies consisting of 357,146,562 people shows a moderate negative correlation between the proportion of Immigrants from Western Africa and household income with householder between the ages 45 and 64 in the United States with a correlation coefficient (R) of -0.427 and weighted average of $92,384. Similarly, the statistical analysis conducted on geographies consisting of 96,163,125 people shows a poor negative correlation between the proportion of Delaware and household income with householder between the ages 45 and 64 in the United States with a correlation coefficient (R) of -0.108 and weighted average of $94,914, a difference of 2.7%.
Householder Income Ages 45 - 64 years Correlation Summary
| Measurement | Immigrants from Western Africa | Delaware |
| Minimum | $43,559 | $29,844 |
| Maximum | $120,552 | $141,667 |
| Range | $76,993 | $111,823 |
| Mean | $84,916 | $86,309 |
| Median | $85,582 | $87,768 |
| Interquartile 25% (IQ1) | $72,214 | $71,250 |
| Interquartile 75% (IQ3) | $97,099 | $103,023 |
| Interquartile Range (IQR) | $24,885 | $31,773 |
| Standard Deviation (Sample) | $15,570 | $24,513 |
| Standard Deviation (Population) | $15,455 | $24,318 |
Demographics Similar to Immigrants from Western Africa and Delaware by Householder Income Ages 45 - 64 years
In terms of householder income ages 45 - 64 years, the demographic groups most similar to Immigrants from Western Africa are Nicaraguan ($92,554, a difference of 0.18%), Immigrants from Bangladesh ($92,208, a difference of 0.19%), Immigrants from El Salvador ($93,176, a difference of 0.86%), Nepalese ($93,355, a difference of 1.1%), and Sudanese ($93,718, a difference of 1.4%). Similarly, the demographic groups most similar to Delaware are Immigrants from Armenia ($94,863, a difference of 0.050%), Immigrants from Ghana ($94,982, a difference of 0.070%), Salvadoran ($94,842, a difference of 0.080%), Immigrants from Nigeria ($94,804, a difference of 0.12%), and Malaysian ($94,517, a difference of 0.42%).
| Demographics | Rating | Rank | Householder Income Ages 45 - 64 years |
| Immigrants | Ghana | 6.4 /100 | #217 | Tragic $94,982 |
| Delaware | 6.2 /100 | #218 | Tragic $94,914 |
| Immigrants | Armenia | 6.1 /100 | #219 | Tragic $94,863 |
| Salvadorans | 6.0 /100 | #220 | Tragic $94,842 |
| Immigrants | Nigeria | 5.9 /100 | #221 | Tragic $94,804 |
| Malaysians | 5.2 /100 | #222 | Tragic $94,517 |
| Immigrants | Nonimmigrants | 5.0 /100 | #223 | Tragic $94,448 |
| Immigrants | Bosnia and Herzegovina | 4.6 /100 | #224 | Tragic $94,288 |
| Bermudans | 4.4 /100 | #225 | Tragic $94,197 |
| Immigrants | Azores | 4.3 /100 | #226 | Tragic $94,138 |
| Alaska Natives | 4.0 /100 | #227 | Tragic $93,991 |
| Immigrants | Panama | 3.7 /100 | #228 | Tragic $93,815 |
| Vietnamese | 3.6 /100 | #229 | Tragic $93,788 |
| Immigrants | Sudan | 3.6 /100 | #230 | Tragic $93,781 |
| Ecuadorians | 3.6 /100 | #231 | Tragic $93,739 |
| Sudanese | 3.5 /100 | #232 | Tragic $93,718 |
| Nepalese | 3.0 /100 | #233 | Tragic $93,355 |
| Immigrants | El Salvador | 2.7 /100 | #234 | Tragic $93,176 |
| Nicaraguans | 2.0 /100 | #235 | Tragic $92,554 |
| Immigrants | Western Africa | 1.8 /100 | #236 | Tragic $92,384 |
| Immigrants | Bangladesh | 1.7 /100 | #237 | Tragic $92,208 |