Taiwanese vs Delaware Householder Income Ages 45 - 64 years
COMPARE
Taiwanese
Delaware
Householder Income Ages 45 - 64 years
Householder Income Ages 45 - 64 years Comparison
Taiwanese
Delaware
$104,180
HOUSEHOLDER INCOME AGES 45 - 64 YEARS
87.4/ 100
METRIC RATING
136th/ 347
METRIC RANK
$94,914
HOUSEHOLDER INCOME AGES 45 - 64 YEARS
6.2/ 100
METRIC RATING
218th/ 347
METRIC RANK
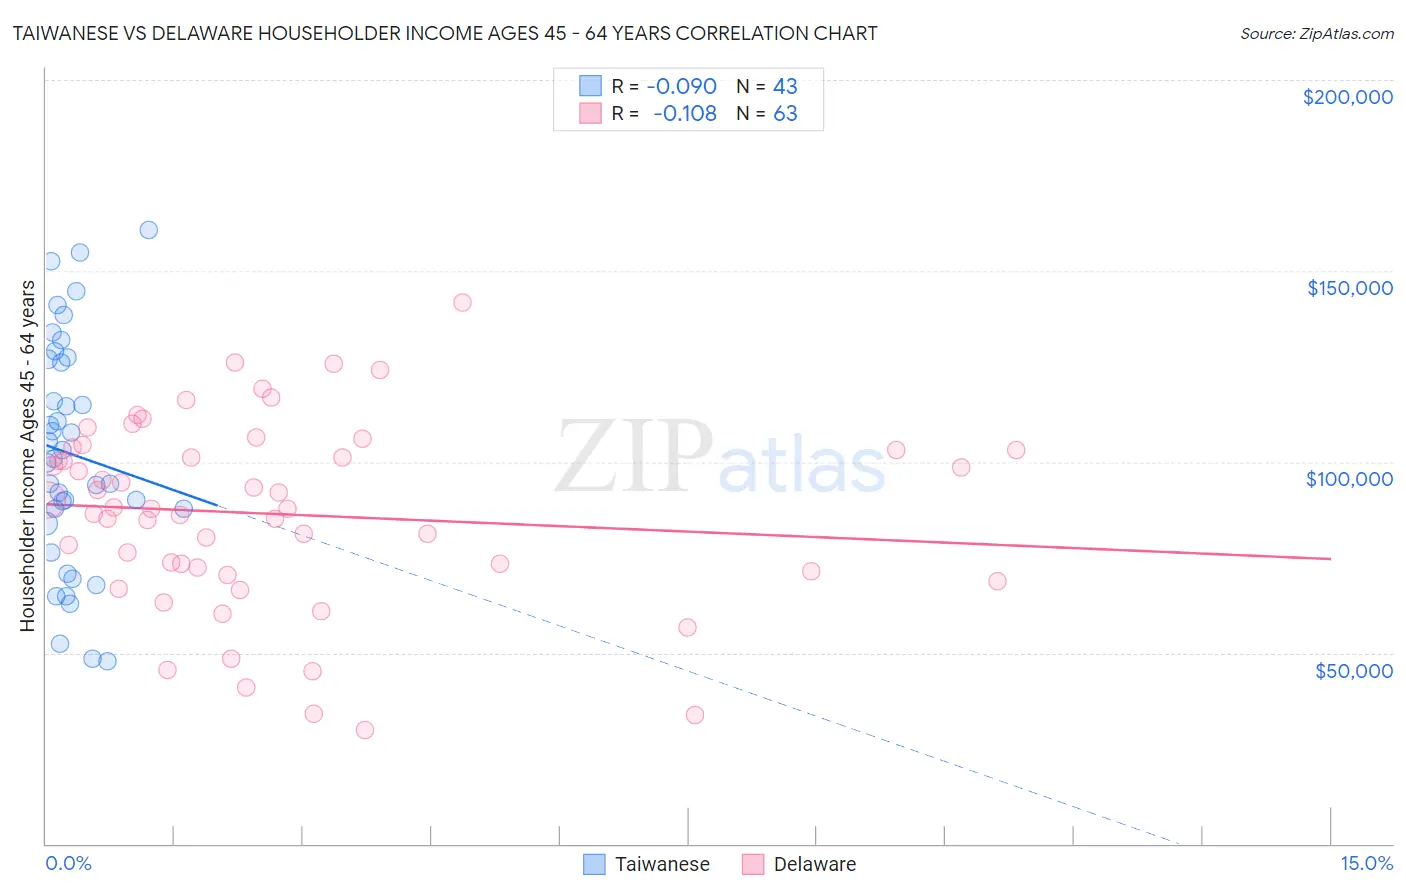
Taiwanese vs Delaware Householder Income Ages 45 - 64 years Correlation Chart
The statistical analysis conducted on geographies consisting of 31,709,295 people shows a slight negative correlation between the proportion of Taiwanese and household income with householder between the ages 45 and 64 in the United States with a correlation coefficient (R) of -0.090 and weighted average of $104,180. Similarly, the statistical analysis conducted on geographies consisting of 96,163,125 people shows a poor negative correlation between the proportion of Delaware and household income with householder between the ages 45 and 64 in the United States with a correlation coefficient (R) of -0.108 and weighted average of $94,914, a difference of 9.8%.
Householder Income Ages 45 - 64 years Correlation Summary
| Measurement | Taiwanese | Delaware |
| Minimum | $47,813 | $29,844 |
| Maximum | $160,833 | $141,667 |
| Range | $113,020 | $111,823 |
| Mean | $102,027 | $86,309 |
| Median | $100,891 | $87,768 |
| Interquartile 25% (IQ1) | $83,846 | $71,250 |
| Interquartile 75% (IQ3) | $126,896 | $103,023 |
| Interquartile Range (IQR) | $43,050 | $31,773 |
| Standard Deviation (Sample) | $29,530 | $24,513 |
| Standard Deviation (Population) | $29,184 | $24,318 |
Similar Demographics by Householder Income Ages 45 - 64 years
Demographics Similar to Taiwanese by Householder Income Ages 45 - 64 years
In terms of householder income ages 45 - 64 years, the demographic groups most similar to Taiwanese are Brazilian ($104,408, a difference of 0.22%), Hungarian ($103,913, a difference of 0.26%), Canadian ($104,560, a difference of 0.36%), Arab ($104,566, a difference of 0.37%), and Ethiopian ($103,736, a difference of 0.43%).
| Demographics | Rating | Rank | Householder Income Ages 45 - 64 years |
| Peruvians | 91.5 /100 | #129 | Exceptional $105,070 |
| Immigrants | Zimbabwe | 91.2 /100 | #130 | Exceptional $104,992 |
| Immigrants | Syria | 90.7 /100 | #131 | Exceptional $104,858 |
| Lebanese | 90.1 /100 | #132 | Exceptional $104,734 |
| Arabs | 89.3 /100 | #133 | Excellent $104,566 |
| Canadians | 89.3 /100 | #134 | Excellent $104,560 |
| Brazilians | 88.6 /100 | #135 | Excellent $104,408 |
| Taiwanese | 87.4 /100 | #136 | Excellent $104,180 |
| Hungarians | 85.8 /100 | #137 | Excellent $103,913 |
| Ethiopians | 84.7 /100 | #138 | Excellent $103,736 |
| Immigrants | Oceania | 84.5 /100 | #139 | Excellent $103,705 |
| Norwegians | 84.3 /100 | #140 | Excellent $103,682 |
| Immigrants | Uganda | 83.7 /100 | #141 | Excellent $103,584 |
| Luxembourgers | 83.3 /100 | #142 | Excellent $103,536 |
| Serbians | 83.2 /100 | #143 | Excellent $103,522 |
Demographics Similar to Delaware by Householder Income Ages 45 - 64 years
In terms of householder income ages 45 - 64 years, the demographic groups most similar to Delaware are Immigrants from Armenia ($94,863, a difference of 0.050%), Immigrants from Ghana ($94,982, a difference of 0.070%), Salvadoran ($94,842, a difference of 0.080%), Immigrants from Nigeria ($94,804, a difference of 0.12%), and Malaysian ($94,517, a difference of 0.42%).
| Demographics | Rating | Rank | Householder Income Ages 45 - 64 years |
| Immigrants | Cambodia | 13.0 /100 | #211 | Poor $96,537 |
| Venezuelans | 12.6 /100 | #212 | Poor $96,460 |
| Immigrants | Uruguay | 10.7 /100 | #213 | Poor $96,086 |
| Panamanians | 10.6 /100 | #214 | Poor $96,066 |
| Nigerians | 8.2 /100 | #215 | Tragic $95,492 |
| Immigrants | Venezuela | 7.6 /100 | #216 | Tragic $95,342 |
| Immigrants | Ghana | 6.4 /100 | #217 | Tragic $94,982 |
| Delaware | 6.2 /100 | #218 | Tragic $94,914 |
| Immigrants | Armenia | 6.1 /100 | #219 | Tragic $94,863 |
| Salvadorans | 6.0 /100 | #220 | Tragic $94,842 |
| Immigrants | Nigeria | 5.9 /100 | #221 | Tragic $94,804 |
| Malaysians | 5.2 /100 | #222 | Tragic $94,517 |
| Immigrants | Nonimmigrants | 5.0 /100 | #223 | Tragic $94,448 |
| Immigrants | Bosnia and Herzegovina | 4.6 /100 | #224 | Tragic $94,288 |
| Bermudans | 4.4 /100 | #225 | Tragic $94,197 |