Haitian vs Delaware Householder Income Ages 45 - 64 years
COMPARE
Haitian
Delaware
Householder Income Ages 45 - 64 years
Householder Income Ages 45 - 64 years Comparison
Haitians
Delaware
$84,384
HOUSEHOLDER INCOME AGES 45 - 64 YEARS
0.0/ 100
METRIC RATING
302nd/ 347
METRIC RANK
$94,914
HOUSEHOLDER INCOME AGES 45 - 64 YEARS
6.2/ 100
METRIC RATING
218th/ 347
METRIC RANK
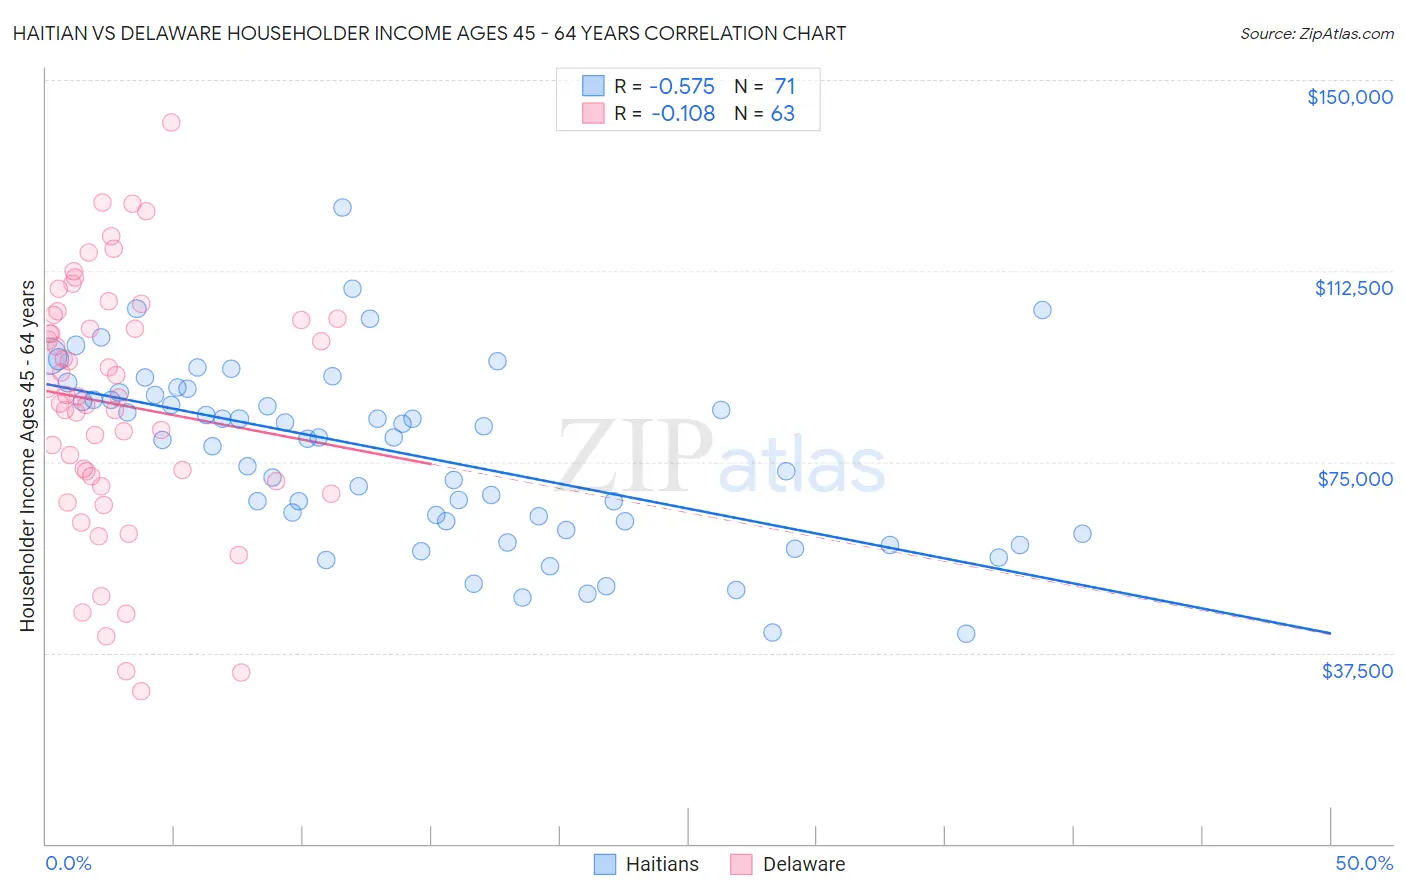
Haitian vs Delaware Householder Income Ages 45 - 64 years Correlation Chart
The statistical analysis conducted on geographies consisting of 287,353,050 people shows a substantial negative correlation between the proportion of Haitians and household income with householder between the ages 45 and 64 in the United States with a correlation coefficient (R) of -0.575 and weighted average of $84,384. Similarly, the statistical analysis conducted on geographies consisting of 96,163,125 people shows a poor negative correlation between the proportion of Delaware and household income with householder between the ages 45 and 64 in the United States with a correlation coefficient (R) of -0.108 and weighted average of $94,914, a difference of 12.5%.
Householder Income Ages 45 - 64 years Correlation Summary
| Measurement | Haitian | Delaware |
| Minimum | $41,306 | $29,844 |
| Maximum | $125,012 | $141,667 |
| Range | $83,706 | $111,823 |
| Mean | $76,677 | $86,309 |
| Median | $79,782 | $87,768 |
| Interquartile 25% (IQ1) | $63,219 | $71,250 |
| Interquartile 75% (IQ3) | $88,532 | $103,023 |
| Interquartile Range (IQR) | $25,313 | $31,773 |
| Standard Deviation (Sample) | $17,503 | $24,513 |
| Standard Deviation (Population) | $17,379 | $24,318 |
Similar Demographics by Householder Income Ages 45 - 64 years
Demographics Similar to Haitians by Householder Income Ages 45 - 64 years
In terms of householder income ages 45 - 64 years, the demographic groups most similar to Haitians are Potawatomi ($84,613, a difference of 0.27%), Honduran ($84,079, a difference of 0.36%), Ottawa ($83,953, a difference of 0.51%), Chippewa ($83,943, a difference of 0.52%), and Ute ($83,937, a difference of 0.53%).
| Demographics | Rating | Rank | Householder Income Ages 45 - 64 years |
| Immigrants | Grenada | 0.1 /100 | #295 | Tragic $85,552 |
| Immigrants | Zaire | 0.1 /100 | #296 | Tragic $85,207 |
| Fijians | 0.1 /100 | #297 | Tragic $85,187 |
| Africans | 0.0 /100 | #298 | Tragic $84,925 |
| Immigrants | Mexico | 0.0 /100 | #299 | Tragic $84,910 |
| Indonesians | 0.0 /100 | #300 | Tragic $84,890 |
| Potawatomi | 0.0 /100 | #301 | Tragic $84,613 |
| Haitians | 0.0 /100 | #302 | Tragic $84,384 |
| Hondurans | 0.0 /100 | #303 | Tragic $84,079 |
| Ottawa | 0.0 /100 | #304 | Tragic $83,953 |
| Chippewa | 0.0 /100 | #305 | Tragic $83,943 |
| Ute | 0.0 /100 | #306 | Tragic $83,937 |
| Shoshone | 0.0 /100 | #307 | Tragic $83,588 |
| Immigrants | Cabo Verde | 0.0 /100 | #308 | Tragic $83,542 |
| Immigrants | Dominica | 0.0 /100 | #309 | Tragic $83,311 |
Demographics Similar to Delaware by Householder Income Ages 45 - 64 years
In terms of householder income ages 45 - 64 years, the demographic groups most similar to Delaware are Immigrants from Armenia ($94,863, a difference of 0.050%), Immigrants from Ghana ($94,982, a difference of 0.070%), Salvadoran ($94,842, a difference of 0.080%), Immigrants from Nigeria ($94,804, a difference of 0.12%), and Malaysian ($94,517, a difference of 0.42%).
| Demographics | Rating | Rank | Householder Income Ages 45 - 64 years |
| Immigrants | Cambodia | 13.0 /100 | #211 | Poor $96,537 |
| Venezuelans | 12.6 /100 | #212 | Poor $96,460 |
| Immigrants | Uruguay | 10.7 /100 | #213 | Poor $96,086 |
| Panamanians | 10.6 /100 | #214 | Poor $96,066 |
| Nigerians | 8.2 /100 | #215 | Tragic $95,492 |
| Immigrants | Venezuela | 7.6 /100 | #216 | Tragic $95,342 |
| Immigrants | Ghana | 6.4 /100 | #217 | Tragic $94,982 |
| Delaware | 6.2 /100 | #218 | Tragic $94,914 |
| Immigrants | Armenia | 6.1 /100 | #219 | Tragic $94,863 |
| Salvadorans | 6.0 /100 | #220 | Tragic $94,842 |
| Immigrants | Nigeria | 5.9 /100 | #221 | Tragic $94,804 |
| Malaysians | 5.2 /100 | #222 | Tragic $94,517 |
| Immigrants | Nonimmigrants | 5.0 /100 | #223 | Tragic $94,448 |
| Immigrants | Bosnia and Herzegovina | 4.6 /100 | #224 | Tragic $94,288 |
| Bermudans | 4.4 /100 | #225 | Tragic $94,197 |