Immigrants from Cameroon vs Nepalese Median Earnings
COMPARE
Immigrants from Cameroon
Nepalese
Median Earnings
Median Earnings Comparison
Immigrants from Cameroon
Nepalese
$46,329
MEDIAN EARNINGS
46.4/ 100
METRIC RATING
181st/ 347
METRIC RANK
$43,860
MEDIAN EARNINGS
2.6/ 100
METRIC RATING
248th/ 347
METRIC RANK
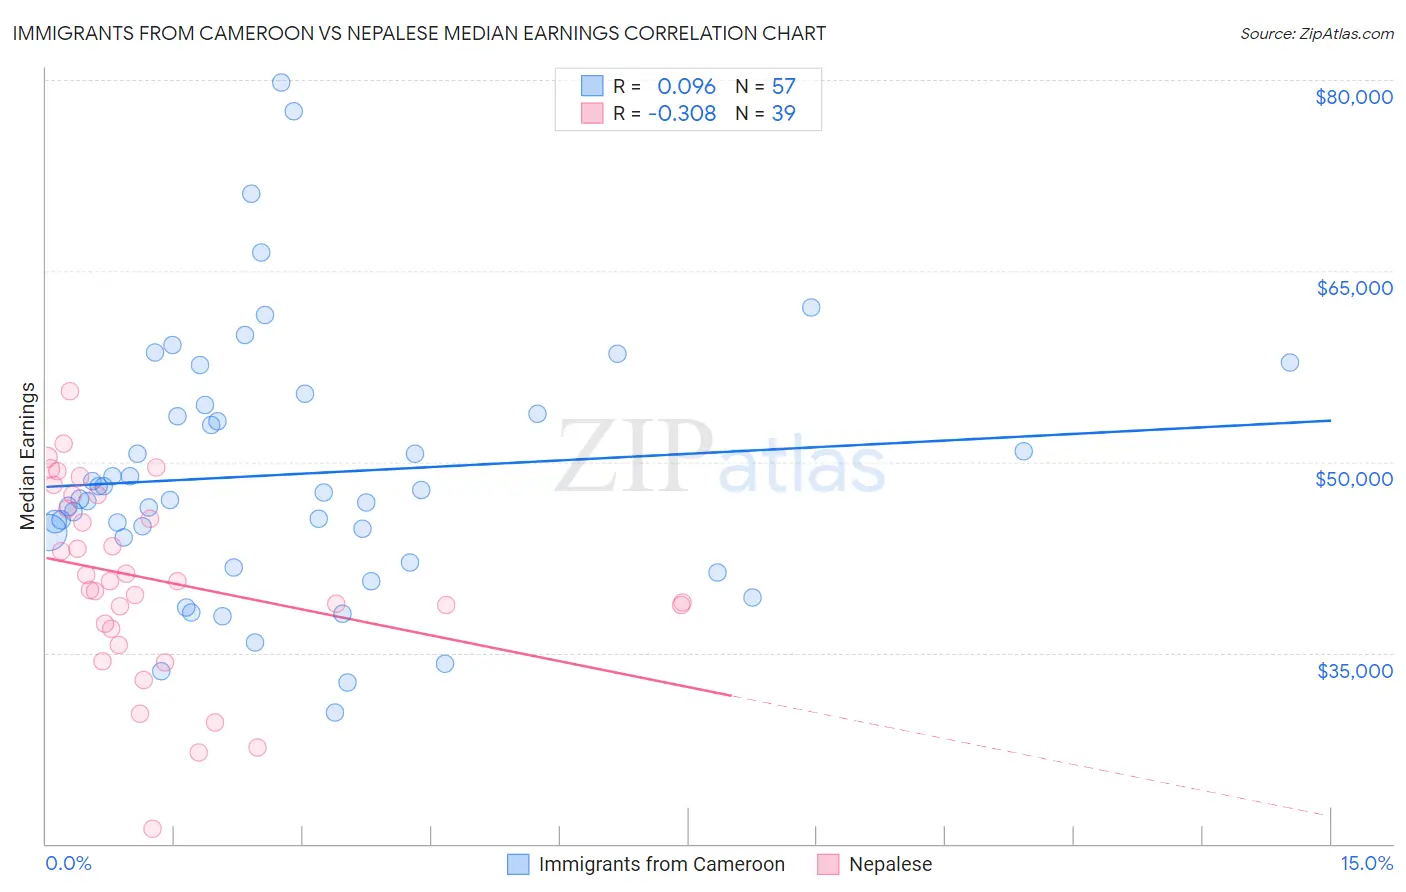
Immigrants from Cameroon vs Nepalese Median Earnings Correlation Chart
The statistical analysis conducted on geographies consisting of 130,751,412 people shows a slight positive correlation between the proportion of Immigrants from Cameroon and median earnings in the United States with a correlation coefficient (R) of 0.096 and weighted average of $46,329. Similarly, the statistical analysis conducted on geographies consisting of 24,434,314 people shows a mild negative correlation between the proportion of Nepalese and median earnings in the United States with a correlation coefficient (R) of -0.308 and weighted average of $43,860, a difference of 5.6%.
Median Earnings Correlation Summary
| Measurement | Immigrants from Cameroon | Nepalese |
| Minimum | $30,304 | $21,187 |
| Maximum | $79,786 | $55,594 |
| Range | $49,482 | $34,407 |
| Mean | $49,022 | $40,712 |
| Median | $47,064 | $40,613 |
| Interquartile 25% (IQ1) | $43,064 | $36,926 |
| Interquartile 75% (IQ3) | $54,101 | $47,393 |
| Interquartile Range (IQR) | $11,037 | $10,467 |
| Standard Deviation (Sample) | $10,190 | $7,531 |
| Standard Deviation (Population) | $10,100 | $7,434 |
Similar Demographics by Median Earnings
Demographics Similar to Immigrants from Cameroon by Median Earnings
In terms of median earnings, the demographic groups most similar to Immigrants from Cameroon are English ($46,334, a difference of 0.010%), Puget Sound Salish ($46,333, a difference of 0.010%), Swiss ($46,315, a difference of 0.030%), Colombian ($46,349, a difference of 0.040%), and French ($46,296, a difference of 0.070%).
| Demographics | Rating | Rank | Median Earnings |
| Scandinavians | 50.0 /100 | #174 | Average $46,433 |
| Basques | 48.8 /100 | #175 | Average $46,399 |
| Danes | 48.6 /100 | #176 | Average $46,392 |
| Belgians | 48.0 /100 | #177 | Average $46,375 |
| Colombians | 47.1 /100 | #178 | Average $46,349 |
| English | 46.5 /100 | #179 | Average $46,334 |
| Puget Sound Salish | 46.5 /100 | #180 | Average $46,333 |
| Immigrants | Cameroon | 46.4 /100 | #181 | Average $46,329 |
| Swiss | 45.9 /100 | #182 | Average $46,315 |
| French | 45.2 /100 | #183 | Average $46,296 |
| Immigrants | Kenya | 42.4 /100 | #184 | Average $46,214 |
| Uruguayans | 41.6 /100 | #185 | Average $46,190 |
| Vietnamese | 40.9 /100 | #186 | Average $46,172 |
| Iraqis | 39.9 /100 | #187 | Fair $46,140 |
| Immigrants | Armenia | 38.3 /100 | #188 | Fair $46,094 |
Demographics Similar to Nepalese by Median Earnings
In terms of median earnings, the demographic groups most similar to Nepalese are Malaysian ($43,844, a difference of 0.040%), Immigrants from Cabo Verde ($43,963, a difference of 0.24%), Alaska Native ($43,750, a difference of 0.25%), Immigrants from West Indies ($43,989, a difference of 0.29%), and Immigrants from Burma/Myanmar ($43,998, a difference of 0.31%).
| Demographics | Rating | Rank | Median Earnings |
| Samoans | 4.2 /100 | #241 | Tragic $44,206 |
| Immigrants | Venezuela | 4.0 /100 | #242 | Tragic $44,163 |
| Sub-Saharan Africans | 3.7 /100 | #243 | Tragic $44,118 |
| Immigrants | Nonimmigrants | 3.7 /100 | #244 | Tragic $44,117 |
| Immigrants | Burma/Myanmar | 3.2 /100 | #245 | Tragic $43,998 |
| Immigrants | West Indies | 3.1 /100 | #246 | Tragic $43,989 |
| Immigrants | Cabo Verde | 3.0 /100 | #247 | Tragic $43,963 |
| Nepalese | 2.6 /100 | #248 | Tragic $43,860 |
| Malaysians | 2.6 /100 | #249 | Tragic $43,844 |
| Alaska Natives | 2.3 /100 | #250 | Tragic $43,750 |
| Tsimshian | 2.1 /100 | #251 | Tragic $43,695 |
| Hawaiians | 2.0 /100 | #252 | Tragic $43,673 |
| Somalis | 1.8 /100 | #253 | Tragic $43,567 |
| Liberians | 1.7 /100 | #254 | Tragic $43,536 |
| Immigrants | Middle Africa | 1.4 /100 | #255 | Tragic $43,416 |