Immigrants from Cameroon vs Palestinian Median Earnings
COMPARE
Immigrants from Cameroon
Palestinian
Median Earnings
Median Earnings Comparison
Immigrants from Cameroon
Palestinians
$46,329
MEDIAN EARNINGS
46.4/ 100
METRIC RATING
181st/ 347
METRIC RANK
$49,209
MEDIAN EARNINGS
98.0/ 100
METRIC RATING
108th/ 347
METRIC RANK
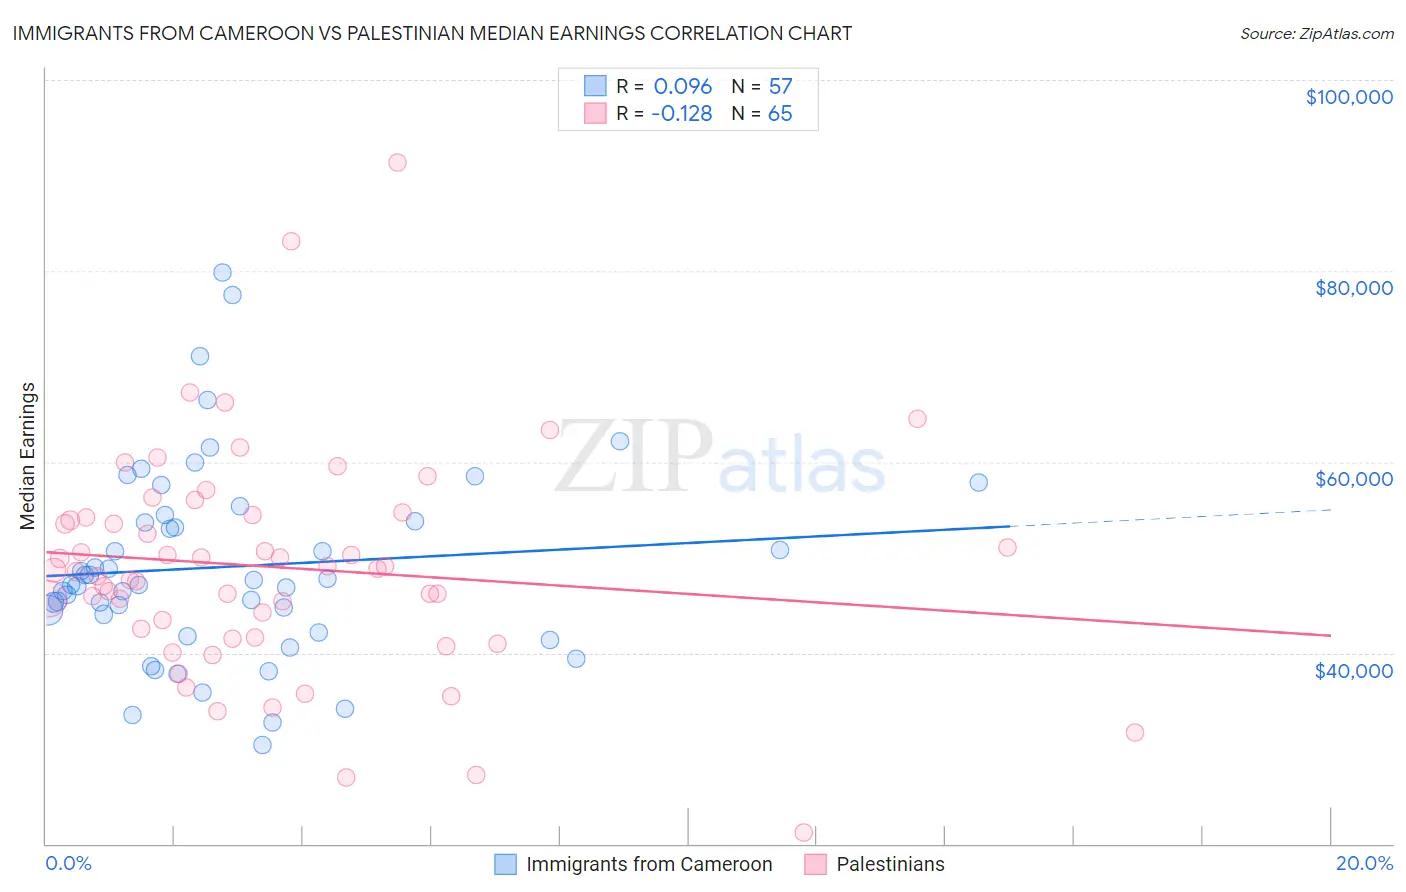
Immigrants from Cameroon vs Palestinian Median Earnings Correlation Chart
The statistical analysis conducted on geographies consisting of 130,751,412 people shows a slight positive correlation between the proportion of Immigrants from Cameroon and median earnings in the United States with a correlation coefficient (R) of 0.096 and weighted average of $46,329. Similarly, the statistical analysis conducted on geographies consisting of 216,457,574 people shows a poor negative correlation between the proportion of Palestinians and median earnings in the United States with a correlation coefficient (R) of -0.128 and weighted average of $49,209, a difference of 6.2%.
Median Earnings Correlation Summary
| Measurement | Immigrants from Cameroon | Palestinian |
| Minimum | $30,304 | $21,204 |
| Maximum | $79,786 | $91,328 |
| Range | $49,482 | $70,124 |
| Mean | $49,022 | $48,950 |
| Median | $47,064 | $48,622 |
| Interquartile 25% (IQ1) | $43,064 | $42,020 |
| Interquartile 75% (IQ3) | $54,101 | $54,336 |
| Interquartile Range (IQR) | $11,037 | $12,316 |
| Standard Deviation (Sample) | $10,190 | $11,660 |
| Standard Deviation (Population) | $10,100 | $11,570 |
Similar Demographics by Median Earnings
Demographics Similar to Immigrants from Cameroon by Median Earnings
In terms of median earnings, the demographic groups most similar to Immigrants from Cameroon are English ($46,334, a difference of 0.010%), Puget Sound Salish ($46,333, a difference of 0.010%), Swiss ($46,315, a difference of 0.030%), Colombian ($46,349, a difference of 0.040%), and French ($46,296, a difference of 0.070%).
| Demographics | Rating | Rank | Median Earnings |
| Scandinavians | 50.0 /100 | #174 | Average $46,433 |
| Basques | 48.8 /100 | #175 | Average $46,399 |
| Danes | 48.6 /100 | #176 | Average $46,392 |
| Belgians | 48.0 /100 | #177 | Average $46,375 |
| Colombians | 47.1 /100 | #178 | Average $46,349 |
| English | 46.5 /100 | #179 | Average $46,334 |
| Puget Sound Salish | 46.5 /100 | #180 | Average $46,333 |
| Immigrants | Cameroon | 46.4 /100 | #181 | Average $46,329 |
| Swiss | 45.9 /100 | #182 | Average $46,315 |
| French | 45.2 /100 | #183 | Average $46,296 |
| Immigrants | Kenya | 42.4 /100 | #184 | Average $46,214 |
| Uruguayans | 41.6 /100 | #185 | Average $46,190 |
| Vietnamese | 40.9 /100 | #186 | Average $46,172 |
| Iraqis | 39.9 /100 | #187 | Fair $46,140 |
| Immigrants | Armenia | 38.3 /100 | #188 | Fair $46,094 |
Demographics Similar to Palestinians by Median Earnings
In terms of median earnings, the demographic groups most similar to Palestinians are Immigrants from Morocco ($49,368, a difference of 0.32%), Immigrants from Albania ($49,377, a difference of 0.34%), Immigrants from Western Asia ($49,389, a difference of 0.37%), Immigrants from Brazil ($49,463, a difference of 0.52%), and Syrian ($48,934, a difference of 0.56%).
| Demographics | Rating | Rank | Median Earnings |
| Jordanians | 98.9 /100 | #101 | Exceptional $49,632 |
| Ethiopians | 98.8 /100 | #102 | Exceptional $49,572 |
| Austrians | 98.7 /100 | #103 | Exceptional $49,501 |
| Immigrants | Brazil | 98.6 /100 | #104 | Exceptional $49,463 |
| Immigrants | Western Asia | 98.4 /100 | #105 | Exceptional $49,389 |
| Immigrants | Albania | 98.4 /100 | #106 | Exceptional $49,377 |
| Immigrants | Morocco | 98.4 /100 | #107 | Exceptional $49,368 |
| Palestinians | 98.0 /100 | #108 | Exceptional $49,209 |
| Syrians | 97.1 /100 | #109 | Exceptional $48,934 |
| Immigrants | Ethiopia | 97.1 /100 | #110 | Exceptional $48,924 |
| Immigrants | Zimbabwe | 97.0 /100 | #111 | Exceptional $48,913 |
| Northern Europeans | 96.9 /100 | #112 | Exceptional $48,887 |
| Immigrants | Kuwait | 96.8 /100 | #113 | Exceptional $48,861 |
| Moroccans | 96.7 /100 | #114 | Exceptional $48,838 |
| Chinese | 96.7 /100 | #115 | Exceptional $48,836 |