Immigrants from Cameroon vs Immigrants from Oceania Median Earnings
COMPARE
Immigrants from Cameroon
Immigrants from Oceania
Median Earnings
Median Earnings Comparison
Immigrants from Cameroon
Immigrants from Oceania
$46,329
MEDIAN EARNINGS
46.4/ 100
METRIC RATING
181st/ 347
METRIC RANK
$47,617
MEDIAN EARNINGS
84.1/ 100
METRIC RATING
151st/ 347
METRIC RANK
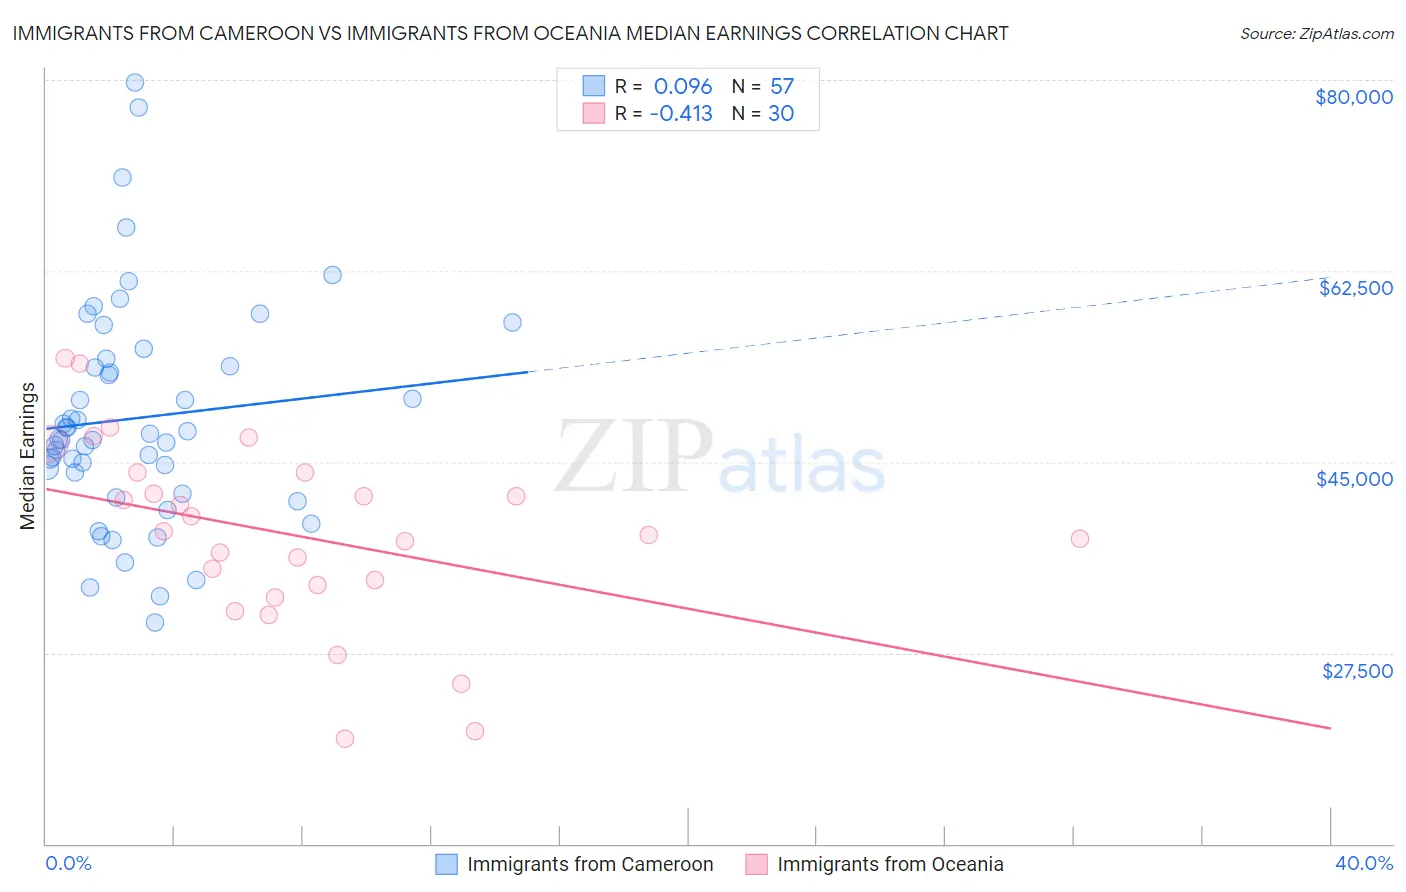
Immigrants from Cameroon vs Immigrants from Oceania Median Earnings Correlation Chart
The statistical analysis conducted on geographies consisting of 130,751,412 people shows a slight positive correlation between the proportion of Immigrants from Cameroon and median earnings in the United States with a correlation coefficient (R) of 0.096 and weighted average of $46,329. Similarly, the statistical analysis conducted on geographies consisting of 305,514,828 people shows a moderate negative correlation between the proportion of Immigrants from Oceania and median earnings in the United States with a correlation coefficient (R) of -0.413 and weighted average of $47,617, a difference of 2.8%.
Median Earnings Correlation Summary
| Measurement | Immigrants from Cameroon | Immigrants from Oceania |
| Minimum | $30,304 | $19,583 |
| Maximum | $79,786 | $54,486 |
| Range | $49,482 | $34,903 |
| Mean | $49,022 | $38,323 |
| Median | $47,064 | $38,462 |
| Interquartile 25% (IQ1) | $43,064 | $33,709 |
| Interquartile 75% (IQ3) | $54,101 | $44,026 |
| Interquartile Range (IQR) | $11,037 | $10,317 |
| Standard Deviation (Sample) | $10,190 | $8,581 |
| Standard Deviation (Population) | $10,100 | $8,437 |
Similar Demographics by Median Earnings
Demographics Similar to Immigrants from Cameroon by Median Earnings
In terms of median earnings, the demographic groups most similar to Immigrants from Cameroon are English ($46,334, a difference of 0.010%), Puget Sound Salish ($46,333, a difference of 0.010%), Swiss ($46,315, a difference of 0.030%), Colombian ($46,349, a difference of 0.040%), and French ($46,296, a difference of 0.070%).
| Demographics | Rating | Rank | Median Earnings |
| Scandinavians | 50.0 /100 | #174 | Average $46,433 |
| Basques | 48.8 /100 | #175 | Average $46,399 |
| Danes | 48.6 /100 | #176 | Average $46,392 |
| Belgians | 48.0 /100 | #177 | Average $46,375 |
| Colombians | 47.1 /100 | #178 | Average $46,349 |
| English | 46.5 /100 | #179 | Average $46,334 |
| Puget Sound Salish | 46.5 /100 | #180 | Average $46,333 |
| Immigrants | Cameroon | 46.4 /100 | #181 | Average $46,329 |
| Swiss | 45.9 /100 | #182 | Average $46,315 |
| French | 45.2 /100 | #183 | Average $46,296 |
| Immigrants | Kenya | 42.4 /100 | #184 | Average $46,214 |
| Uruguayans | 41.6 /100 | #185 | Average $46,190 |
| Vietnamese | 40.9 /100 | #186 | Average $46,172 |
| Iraqis | 39.9 /100 | #187 | Fair $46,140 |
| Immigrants | Armenia | 38.3 /100 | #188 | Fair $46,094 |
Demographics Similar to Immigrants from Oceania by Median Earnings
In terms of median earnings, the demographic groups most similar to Immigrants from Oceania are Peruvian ($47,628, a difference of 0.020%), Luxembourger ($47,640, a difference of 0.050%), Immigrants from Eritrea ($47,657, a difference of 0.080%), Immigrants from South Eastern Asia ($47,671, a difference of 0.11%), and Immigrants from Germany ($47,566, a difference of 0.11%).
| Demographics | Rating | Rank | Median Earnings |
| Hungarians | 87.1 /100 | #144 | Excellent $47,795 |
| Immigrants | Saudi Arabia | 85.6 /100 | #145 | Excellent $47,704 |
| Immigrants | Chile | 85.5 /100 | #146 | Excellent $47,697 |
| Immigrants | South Eastern Asia | 85.0 /100 | #147 | Excellent $47,671 |
| Immigrants | Eritrea | 84.8 /100 | #148 | Excellent $47,657 |
| Luxembourgers | 84.5 /100 | #149 | Excellent $47,640 |
| Peruvians | 84.2 /100 | #150 | Excellent $47,628 |
| Immigrants | Oceania | 84.1 /100 | #151 | Excellent $47,617 |
| Immigrants | Germany | 83.1 /100 | #152 | Excellent $47,566 |
| Slavs | 81.1 /100 | #153 | Excellent $47,470 |
| Immigrants | Portugal | 77.3 /100 | #154 | Good $47,304 |
| Immigrants | Vietnam | 76.7 /100 | #155 | Good $47,282 |
| Irish | 76.6 /100 | #156 | Good $47,276 |
| Czechs | 75.1 /100 | #157 | Good $47,221 |
| Slovaks | 71.7 /100 | #158 | Good $47,095 |