Immigrants from Cambodia vs Nigerian Median Male Earnings
COMPARE
Immigrants from Cambodia
Nigerian
Median Male Earnings
Median Male Earnings Comparison
Immigrants from Cambodia
Nigerians
$51,594
MEDIAN MALE EARNINGS
5.5/ 100
METRIC RATING
224th/ 347
METRIC RANK
$52,039
MEDIAN MALE EARNINGS
8.3/ 100
METRIC RATING
217th/ 347
METRIC RANK
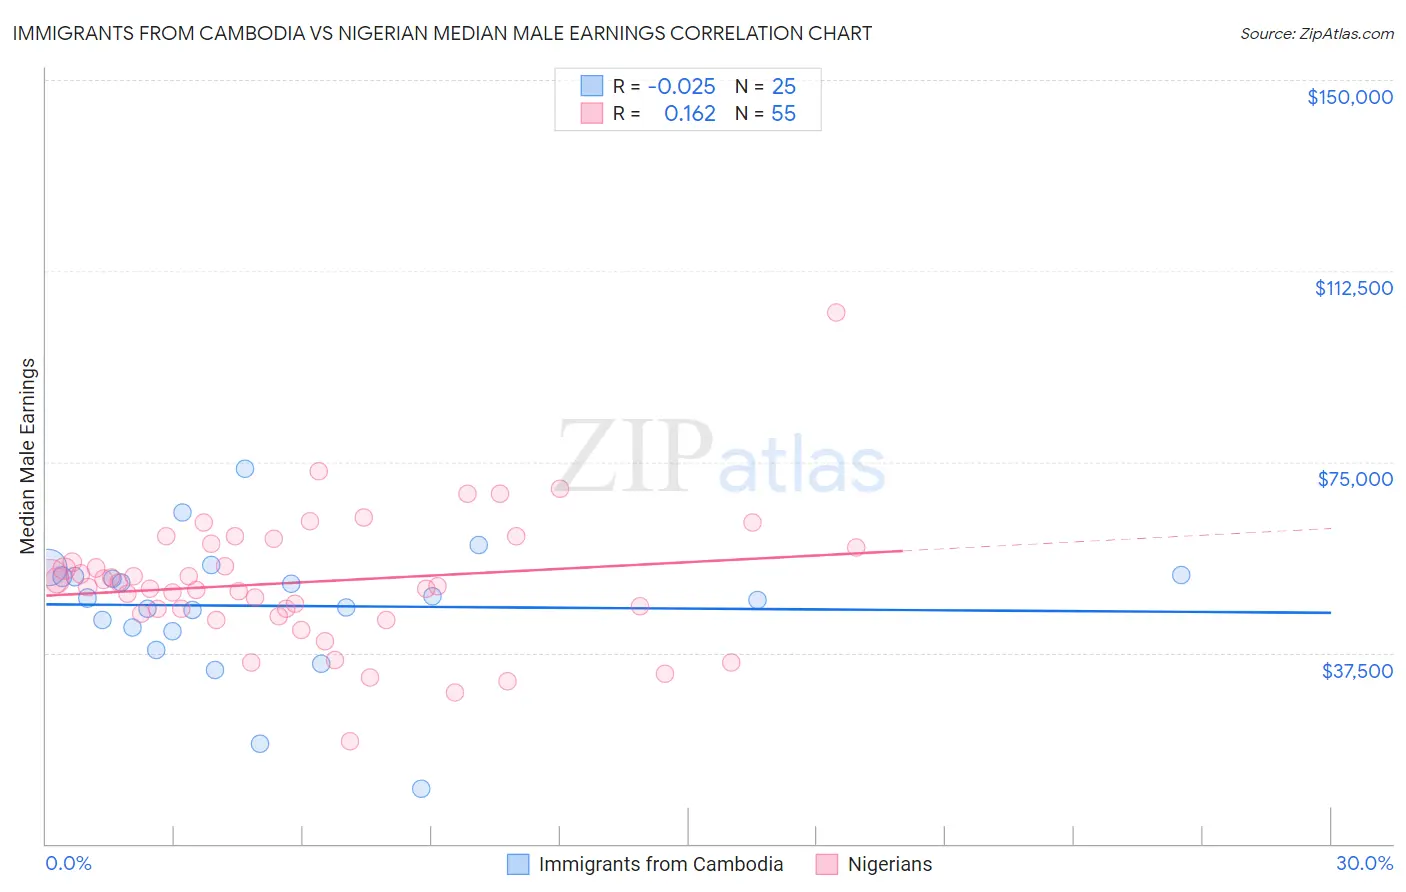
Immigrants from Cambodia vs Nigerian Median Male Earnings Correlation Chart
The statistical analysis conducted on geographies consisting of 205,144,142 people shows no correlation between the proportion of Immigrants from Cambodia and median male earnings in the United States with a correlation coefficient (R) of -0.025 and weighted average of $51,594. Similarly, the statistical analysis conducted on geographies consisting of 332,727,024 people shows a poor positive correlation between the proportion of Nigerians and median male earnings in the United States with a correlation coefficient (R) of 0.162 and weighted average of $52,039, a difference of 0.86%.
Median Male Earnings Correlation Summary
| Measurement | Immigrants from Cambodia | Nigerian |
| Minimum | $10,761 | $20,187 |
| Maximum | $73,759 | $104,375 |
| Range | $62,998 | $84,188 |
| Mean | $46,720 | $51,399 |
| Median | $48,267 | $50,552 |
| Interquartile 25% (IQ1) | $42,101 | $45,099 |
| Interquartile 75% (IQ3) | $52,654 | $58,900 |
| Interquartile Range (IQR) | $10,554 | $13,801 |
| Standard Deviation (Sample) | $12,824 | $12,955 |
| Standard Deviation (Population) | $12,565 | $12,837 |
Demographics Similar to Immigrants from Cambodia and Nigerians by Median Male Earnings
In terms of median male earnings, the demographic groups most similar to Immigrants from Cambodia are Ecuadorian ($51,596, a difference of 0.0%), Immigrants from Bangladesh ($51,642, a difference of 0.090%), Immigrants from Senegal ($51,647, a difference of 0.10%), Immigrants from Sudan ($51,489, a difference of 0.20%), and Japanese ($51,473, a difference of 0.23%). Similarly, the demographic groups most similar to Nigerians are Immigrants from Venezuela ($52,041, a difference of 0.0%), Immigrants from Cameroon ($52,119, a difference of 0.15%), Immigrants from Panama ($51,962, a difference of 0.15%), Nonimmigrants ($52,170, a difference of 0.25%), and Immigrants from Ghana ($51,836, a difference of 0.39%).
| Demographics | Rating | Rank | Median Male Earnings |
| Delaware | 11.5 /100 | #210 | Poor $52,412 |
| Tlingit-Haida | 11.5 /100 | #211 | Poor $52,409 |
| Cajuns | 10.7 /100 | #212 | Poor $52,325 |
| Native Hawaiians | 10.5 /100 | #213 | Poor $52,306 |
| Immigrants | Nonimmigrants | 9.3 /100 | #214 | Tragic $52,170 |
| Immigrants | Cameroon | 8.9 /100 | #215 | Tragic $52,119 |
| Immigrants | Venezuela | 8.3 /100 | #216 | Tragic $52,041 |
| Nigerians | 8.3 /100 | #217 | Tragic $52,039 |
| Immigrants | Panama | 7.7 /100 | #218 | Tragic $51,962 |
| Immigrants | Ghana | 6.9 /100 | #219 | Tragic $51,836 |
| Immigrants | Armenia | 6.6 /100 | #220 | Tragic $51,793 |
| Immigrants | Senegal | 5.8 /100 | #221 | Tragic $51,647 |
| Immigrants | Bangladesh | 5.8 /100 | #222 | Tragic $51,642 |
| Ecuadorians | 5.5 /100 | #223 | Tragic $51,596 |
| Immigrants | Cambodia | 5.5 /100 | #224 | Tragic $51,594 |
| Immigrants | Sudan | 5.0 /100 | #225 | Tragic $51,489 |
| Japanese | 4.9 /100 | #226 | Tragic $51,473 |
| Trinidadians and Tobagonians | 4.8 /100 | #227 | Tragic $51,446 |
| Samoans | 4.6 /100 | #228 | Tragic $51,389 |
| Immigrants | Trinidad and Tobago | 4.5 /100 | #229 | Tragic $51,376 |
| Immigrants | Nigeria | 4.2 /100 | #230 | Tragic $51,310 |