Immigrants from Cambodia vs Immigrants from Nicaragua Median Male Earnings
COMPARE
Immigrants from Cambodia
Immigrants from Nicaragua
Median Male Earnings
Median Male Earnings Comparison
Immigrants from Cambodia
Immigrants from Nicaragua
$51,594
MEDIAN MALE EARNINGS
5.5/ 100
METRIC RATING
224th/ 347
METRIC RANK
$47,482
MEDIAN MALE EARNINGS
0.1/ 100
METRIC RATING
294th/ 347
METRIC RANK
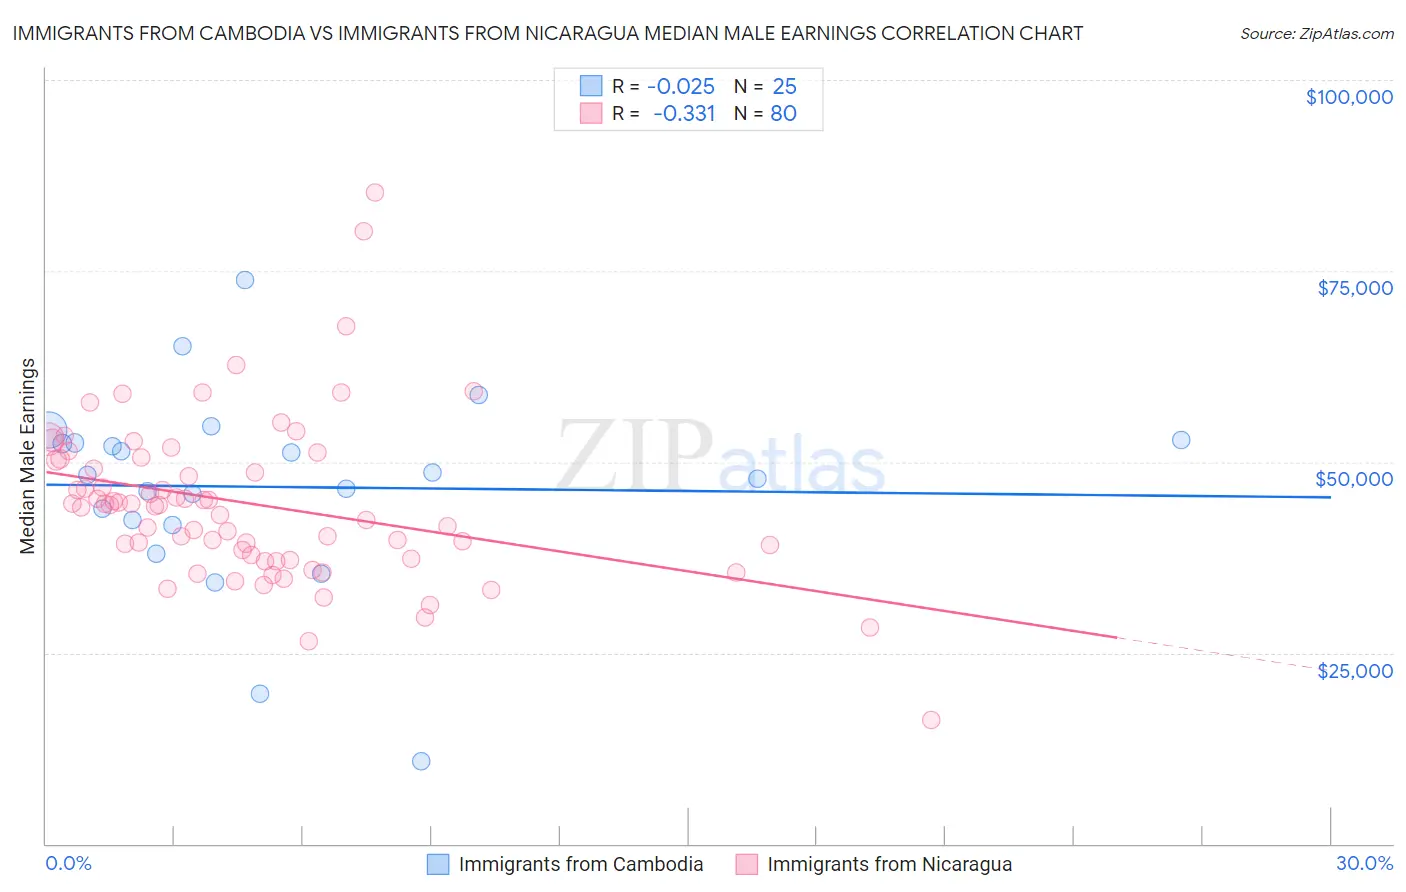
Immigrants from Cambodia vs Immigrants from Nicaragua Median Male Earnings Correlation Chart
The statistical analysis conducted on geographies consisting of 205,144,142 people shows no correlation between the proportion of Immigrants from Cambodia and median male earnings in the United States with a correlation coefficient (R) of -0.025 and weighted average of $51,594. Similarly, the statistical analysis conducted on geographies consisting of 236,305,617 people shows a mild negative correlation between the proportion of Immigrants from Nicaragua and median male earnings in the United States with a correlation coefficient (R) of -0.331 and weighted average of $47,482, a difference of 8.7%.
Median Male Earnings Correlation Summary
| Measurement | Immigrants from Cambodia | Immigrants from Nicaragua |
| Minimum | $10,761 | $16,250 |
| Maximum | $73,759 | $85,319 |
| Range | $62,998 | $69,069 |
| Mean | $46,720 | $44,541 |
| Median | $48,267 | $44,356 |
| Interquartile 25% (IQ1) | $42,101 | $37,535 |
| Interquartile 75% (IQ3) | $52,654 | $50,283 |
| Interquartile Range (IQR) | $10,554 | $12,748 |
| Standard Deviation (Sample) | $12,824 | $10,745 |
| Standard Deviation (Population) | $12,565 | $10,678 |
Similar Demographics by Median Male Earnings
Demographics Similar to Immigrants from Cambodia by Median Male Earnings
In terms of median male earnings, the demographic groups most similar to Immigrants from Cambodia are Ecuadorian ($51,596, a difference of 0.0%), Immigrants from Bangladesh ($51,642, a difference of 0.090%), Immigrants from Senegal ($51,647, a difference of 0.10%), Immigrants from Sudan ($51,489, a difference of 0.20%), and Japanese ($51,473, a difference of 0.23%).
| Demographics | Rating | Rank | Median Male Earnings |
| Nigerians | 8.3 /100 | #217 | Tragic $52,039 |
| Immigrants | Panama | 7.7 /100 | #218 | Tragic $51,962 |
| Immigrants | Ghana | 6.9 /100 | #219 | Tragic $51,836 |
| Immigrants | Armenia | 6.6 /100 | #220 | Tragic $51,793 |
| Immigrants | Senegal | 5.8 /100 | #221 | Tragic $51,647 |
| Immigrants | Bangladesh | 5.8 /100 | #222 | Tragic $51,642 |
| Ecuadorians | 5.5 /100 | #223 | Tragic $51,596 |
| Immigrants | Cambodia | 5.5 /100 | #224 | Tragic $51,594 |
| Immigrants | Sudan | 5.0 /100 | #225 | Tragic $51,489 |
| Japanese | 4.9 /100 | #226 | Tragic $51,473 |
| Trinidadians and Tobagonians | 4.8 /100 | #227 | Tragic $51,446 |
| Samoans | 4.6 /100 | #228 | Tragic $51,389 |
| Immigrants | Trinidad and Tobago | 4.5 /100 | #229 | Tragic $51,376 |
| Immigrants | Nigeria | 4.2 /100 | #230 | Tragic $51,310 |
| Barbadians | 3.9 /100 | #231 | Tragic $51,236 |
Demographics Similar to Immigrants from Nicaragua by Median Male Earnings
In terms of median male earnings, the demographic groups most similar to Immigrants from Nicaragua are Indonesian ($47,503, a difference of 0.040%), Central American Indian ($47,433, a difference of 0.10%), Immigrants from Dominica ($47,651, a difference of 0.36%), Inupiat ($47,281, a difference of 0.43%), and Choctaw ($47,729, a difference of 0.52%).
| Demographics | Rating | Rank | Median Male Earnings |
| Immigrants | El Salvador | 0.2 /100 | #287 | Tragic $47,973 |
| Shoshone | 0.2 /100 | #288 | Tragic $47,930 |
| Chickasaw | 0.1 /100 | #289 | Tragic $47,832 |
| Immigrants | Belize | 0.1 /100 | #290 | Tragic $47,809 |
| Choctaw | 0.1 /100 | #291 | Tragic $47,729 |
| Immigrants | Dominica | 0.1 /100 | #292 | Tragic $47,651 |
| Indonesians | 0.1 /100 | #293 | Tragic $47,503 |
| Immigrants | Nicaragua | 0.1 /100 | #294 | Tragic $47,482 |
| Central American Indians | 0.1 /100 | #295 | Tragic $47,433 |
| Inupiat | 0.1 /100 | #296 | Tragic $47,281 |
| Dominicans | 0.1 /100 | #297 | Tragic $47,204 |
| Immigrants | Micronesia | 0.1 /100 | #298 | Tragic $47,177 |
| Immigrants | Zaire | 0.1 /100 | #299 | Tragic $47,070 |
| U.S. Virgin Islanders | 0.1 /100 | #300 | Tragic $47,066 |
| Immigrants | Latin America | 0.1 /100 | #301 | Tragic $46,941 |