Immigrants from Cambodia vs Sri Lankan Median Male Earnings
COMPARE
Immigrants from Cambodia
Sri Lankan
Median Male Earnings
Median Male Earnings Comparison
Immigrants from Cambodia
Sri Lankans
$51,594
MEDIAN MALE EARNINGS
5.5/ 100
METRIC RATING
224th/ 347
METRIC RANK
$56,136
MEDIAN MALE EARNINGS
83.4/ 100
METRIC RATING
143rd/ 347
METRIC RANK
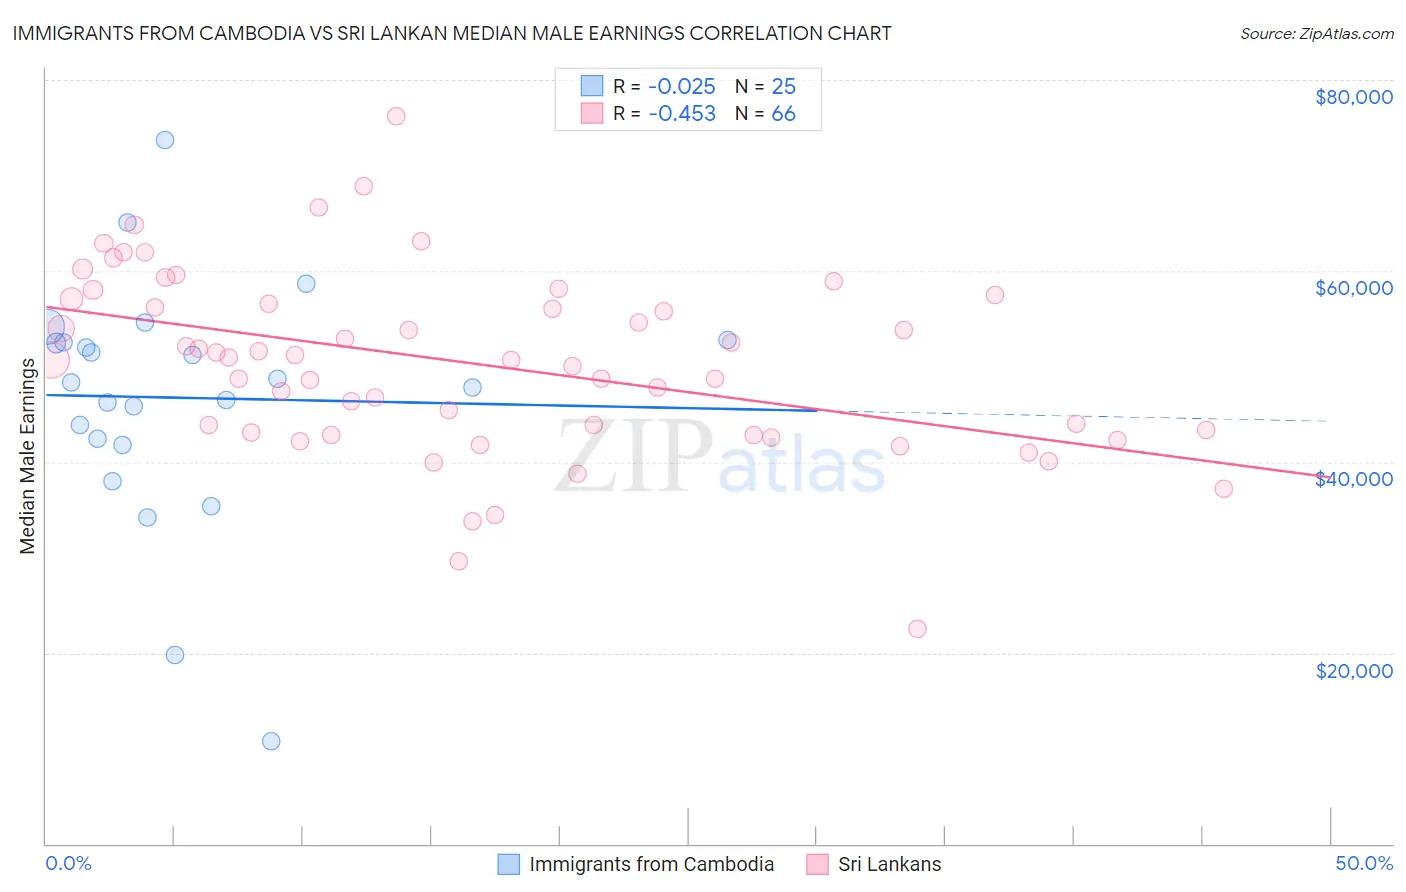
Immigrants from Cambodia vs Sri Lankan Median Male Earnings Correlation Chart
The statistical analysis conducted on geographies consisting of 205,144,142 people shows no correlation between the proportion of Immigrants from Cambodia and median male earnings in the United States with a correlation coefficient (R) of -0.025 and weighted average of $51,594. Similarly, the statistical analysis conducted on geographies consisting of 440,493,989 people shows a moderate negative correlation between the proportion of Sri Lankans and median male earnings in the United States with a correlation coefficient (R) of -0.453 and weighted average of $56,136, a difference of 8.8%.
Median Male Earnings Correlation Summary
| Measurement | Immigrants from Cambodia | Sri Lankan |
| Minimum | $10,761 | $22,532 |
| Maximum | $73,759 | $76,188 |
| Range | $62,998 | $53,656 |
| Mean | $46,720 | $50,350 |
| Median | $48,267 | $50,806 |
| Interquartile 25% (IQ1) | $42,101 | $43,067 |
| Interquartile 75% (IQ3) | $52,654 | $57,026 |
| Interquartile Range (IQR) | $10,554 | $13,959 |
| Standard Deviation (Sample) | $12,824 | $9,663 |
| Standard Deviation (Population) | $12,565 | $9,589 |
Similar Demographics by Median Male Earnings
Demographics Similar to Immigrants from Cambodia by Median Male Earnings
In terms of median male earnings, the demographic groups most similar to Immigrants from Cambodia are Ecuadorian ($51,596, a difference of 0.0%), Immigrants from Bangladesh ($51,642, a difference of 0.090%), Immigrants from Senegal ($51,647, a difference of 0.10%), Immigrants from Sudan ($51,489, a difference of 0.20%), and Japanese ($51,473, a difference of 0.23%).
| Demographics | Rating | Rank | Median Male Earnings |
| Nigerians | 8.3 /100 | #217 | Tragic $52,039 |
| Immigrants | Panama | 7.7 /100 | #218 | Tragic $51,962 |
| Immigrants | Ghana | 6.9 /100 | #219 | Tragic $51,836 |
| Immigrants | Armenia | 6.6 /100 | #220 | Tragic $51,793 |
| Immigrants | Senegal | 5.8 /100 | #221 | Tragic $51,647 |
| Immigrants | Bangladesh | 5.8 /100 | #222 | Tragic $51,642 |
| Ecuadorians | 5.5 /100 | #223 | Tragic $51,596 |
| Immigrants | Cambodia | 5.5 /100 | #224 | Tragic $51,594 |
| Immigrants | Sudan | 5.0 /100 | #225 | Tragic $51,489 |
| Japanese | 4.9 /100 | #226 | Tragic $51,473 |
| Trinidadians and Tobagonians | 4.8 /100 | #227 | Tragic $51,446 |
| Samoans | 4.6 /100 | #228 | Tragic $51,389 |
| Immigrants | Trinidad and Tobago | 4.5 /100 | #229 | Tragic $51,376 |
| Immigrants | Nigeria | 4.2 /100 | #230 | Tragic $51,310 |
| Barbadians | 3.9 /100 | #231 | Tragic $51,236 |
Demographics Similar to Sri Lankans by Median Male Earnings
In terms of median male earnings, the demographic groups most similar to Sri Lankans are Immigrants from Uganda ($56,064, a difference of 0.13%), Danish ($56,246, a difference of 0.19%), Ethiopian ($56,243, a difference of 0.19%), Zimbabwean ($56,302, a difference of 0.29%), and Luxembourger ($56,300, a difference of 0.29%).
| Demographics | Rating | Rank | Median Male Earnings |
| Immigrants | Saudi Arabia | 87.2 /100 | #136 | Excellent $56,452 |
| Slavs | 86.5 /100 | #137 | Excellent $56,390 |
| Slovaks | 85.5 /100 | #138 | Excellent $56,306 |
| Zimbabweans | 85.5 /100 | #139 | Excellent $56,302 |
| Luxembourgers | 85.5 /100 | #140 | Excellent $56,300 |
| Danes | 84.8 /100 | #141 | Excellent $56,246 |
| Ethiopians | 84.8 /100 | #142 | Excellent $56,243 |
| Sri Lankans | 83.4 /100 | #143 | Excellent $56,136 |
| Immigrants | Uganda | 82.4 /100 | #144 | Excellent $56,064 |
| Norwegians | 80.9 /100 | #145 | Excellent $55,965 |
| Immigrants | Chile | 80.7 /100 | #146 | Excellent $55,954 |
| Immigrants | Philippines | 78.4 /100 | #147 | Good $55,809 |
| Scottish | 78.2 /100 | #148 | Good $55,793 |
| English | 77.4 /100 | #149 | Good $55,747 |
| Swiss | 77.1 /100 | #150 | Good $55,731 |