Immigrants from Cambodia vs Immigrants from Switzerland Median Male Earnings
COMPARE
Immigrants from Cambodia
Immigrants from Switzerland
Median Male Earnings
Median Male Earnings Comparison
Immigrants from Cambodia
Immigrants from Switzerland
$51,594
MEDIAN MALE EARNINGS
5.5/ 100
METRIC RATING
224th/ 347
METRIC RANK
$63,944
MEDIAN MALE EARNINGS
100.0/ 100
METRIC RATING
27th/ 347
METRIC RANK
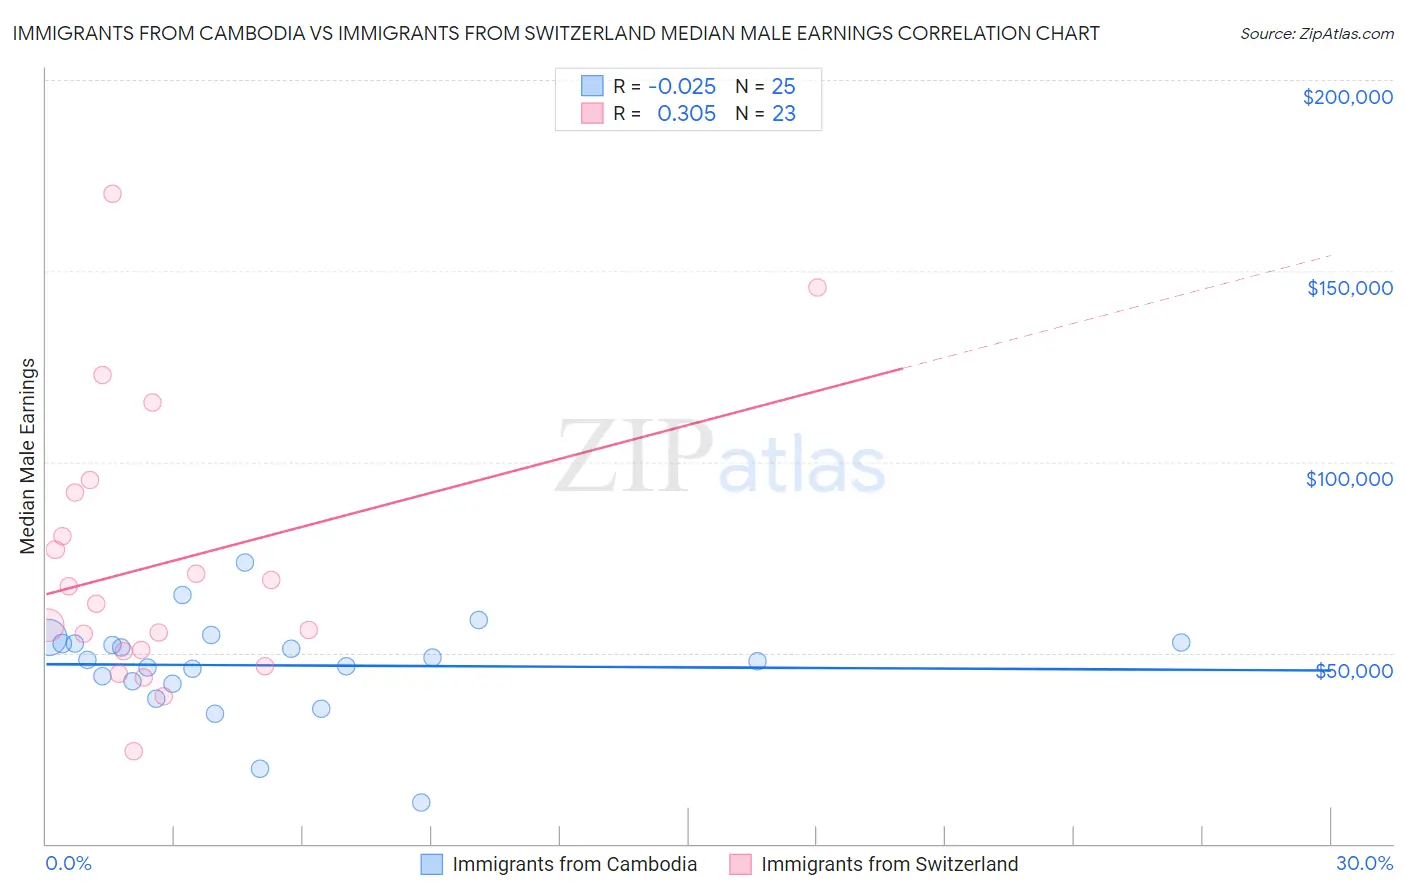
Immigrants from Cambodia vs Immigrants from Switzerland Median Male Earnings Correlation Chart
The statistical analysis conducted on geographies consisting of 205,144,142 people shows no correlation between the proportion of Immigrants from Cambodia and median male earnings in the United States with a correlation coefficient (R) of -0.025 and weighted average of $51,594. Similarly, the statistical analysis conducted on geographies consisting of 148,046,758 people shows a mild positive correlation between the proportion of Immigrants from Switzerland and median male earnings in the United States with a correlation coefficient (R) of 0.305 and weighted average of $63,944, a difference of 23.9%.
Median Male Earnings Correlation Summary
| Measurement | Immigrants from Cambodia | Immigrants from Switzerland |
| Minimum | $10,761 | $24,152 |
| Maximum | $73,759 | $170,239 |
| Range | $62,998 | $146,087 |
| Mean | $46,720 | $73,519 |
| Median | $48,267 | $62,840 |
| Interquartile 25% (IQ1) | $42,101 | $50,348 |
| Interquartile 75% (IQ3) | $52,654 | $91,948 |
| Interquartile Range (IQR) | $10,554 | $41,600 |
| Standard Deviation (Sample) | $12,824 | $35,831 |
| Standard Deviation (Population) | $12,565 | $35,043 |
Similar Demographics by Median Male Earnings
Demographics Similar to Immigrants from Cambodia by Median Male Earnings
In terms of median male earnings, the demographic groups most similar to Immigrants from Cambodia are Ecuadorian ($51,596, a difference of 0.0%), Immigrants from Bangladesh ($51,642, a difference of 0.090%), Immigrants from Senegal ($51,647, a difference of 0.10%), Immigrants from Sudan ($51,489, a difference of 0.20%), and Japanese ($51,473, a difference of 0.23%).
| Demographics | Rating | Rank | Median Male Earnings |
| Nigerians | 8.3 /100 | #217 | Tragic $52,039 |
| Immigrants | Panama | 7.7 /100 | #218 | Tragic $51,962 |
| Immigrants | Ghana | 6.9 /100 | #219 | Tragic $51,836 |
| Immigrants | Armenia | 6.6 /100 | #220 | Tragic $51,793 |
| Immigrants | Senegal | 5.8 /100 | #221 | Tragic $51,647 |
| Immigrants | Bangladesh | 5.8 /100 | #222 | Tragic $51,642 |
| Ecuadorians | 5.5 /100 | #223 | Tragic $51,596 |
| Immigrants | Cambodia | 5.5 /100 | #224 | Tragic $51,594 |
| Immigrants | Sudan | 5.0 /100 | #225 | Tragic $51,489 |
| Japanese | 4.9 /100 | #226 | Tragic $51,473 |
| Trinidadians and Tobagonians | 4.8 /100 | #227 | Tragic $51,446 |
| Samoans | 4.6 /100 | #228 | Tragic $51,389 |
| Immigrants | Trinidad and Tobago | 4.5 /100 | #229 | Tragic $51,376 |
| Immigrants | Nigeria | 4.2 /100 | #230 | Tragic $51,310 |
| Barbadians | 3.9 /100 | #231 | Tragic $51,236 |
Demographics Similar to Immigrants from Switzerland by Median Male Earnings
In terms of median male earnings, the demographic groups most similar to Immigrants from Switzerland are Russian ($63,939, a difference of 0.010%), Asian ($63,827, a difference of 0.18%), Immigrants from France ($63,715, a difference of 0.36%), Turkish ($64,253, a difference of 0.48%), and Latvian ($63,498, a difference of 0.70%).
| Demographics | Rating | Rank | Median Male Earnings |
| Immigrants | Japan | 100.0 /100 | #20 | Exceptional $65,518 |
| Immigrants | Sweden | 100.0 /100 | #21 | Exceptional $65,406 |
| Burmese | 100.0 /100 | #22 | Exceptional $65,236 |
| Immigrants | Korea | 100.0 /100 | #23 | Exceptional $65,079 |
| Immigrants | Northern Europe | 100.0 /100 | #24 | Exceptional $64,987 |
| Immigrants | Denmark | 100.0 /100 | #25 | Exceptional $64,625 |
| Turks | 100.0 /100 | #26 | Exceptional $64,253 |
| Immigrants | Switzerland | 100.0 /100 | #27 | Exceptional $63,944 |
| Russians | 100.0 /100 | #28 | Exceptional $63,939 |
| Asians | 100.0 /100 | #29 | Exceptional $63,827 |
| Immigrants | France | 100.0 /100 | #30 | Exceptional $63,715 |
| Latvians | 100.0 /100 | #31 | Exceptional $63,498 |
| Soviet Union | 100.0 /100 | #32 | Exceptional $63,382 |
| Immigrants | Lithuania | 100.0 /100 | #33 | Exceptional $63,346 |
| Immigrants | Russia | 100.0 /100 | #34 | Exceptional $63,326 |