Immigrants from Cabo Verde vs Native Hawaiian Median Earnings
COMPARE
Immigrants from Cabo Verde
Native Hawaiian
Median Earnings
Median Earnings Comparison
Immigrants from Cabo Verde
Native Hawaiians
$43,963
MEDIAN EARNINGS
3.0/ 100
METRIC RATING
247th/ 347
METRIC RANK
$45,027
MEDIAN EARNINGS
12.2/ 100
METRIC RATING
227th/ 347
METRIC RANK
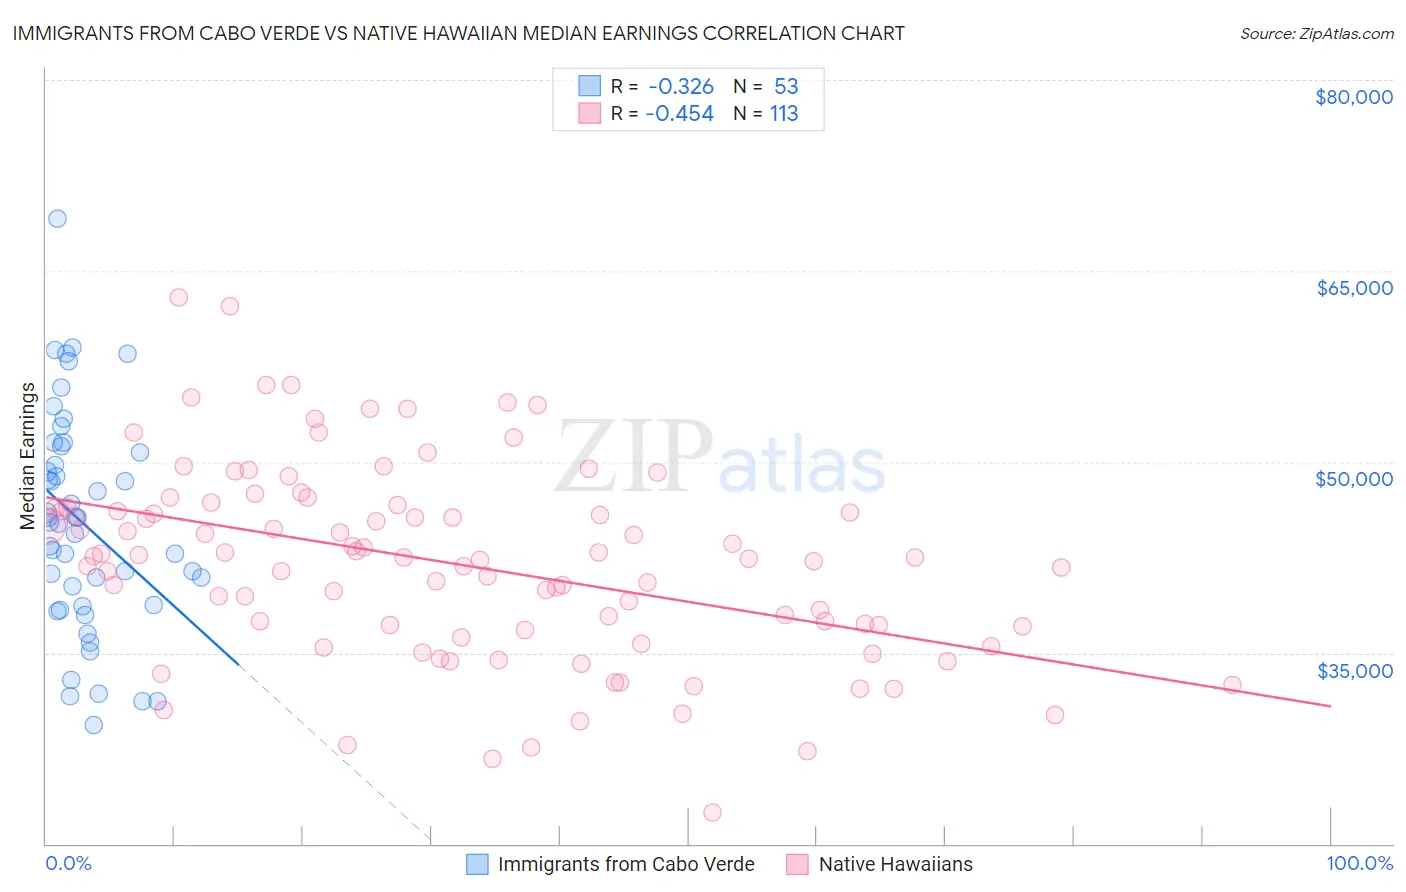
Immigrants from Cabo Verde vs Native Hawaiian Median Earnings Correlation Chart
The statistical analysis conducted on geographies consisting of 38,158,666 people shows a mild negative correlation between the proportion of Immigrants from Cabo Verde and median earnings in the United States with a correlation coefficient (R) of -0.326 and weighted average of $43,963. Similarly, the statistical analysis conducted on geographies consisting of 332,103,903 people shows a moderate negative correlation between the proportion of Native Hawaiians and median earnings in the United States with a correlation coefficient (R) of -0.454 and weighted average of $45,027, a difference of 2.4%.
Median Earnings Correlation Summary
| Measurement | Immigrants from Cabo Verde | Native Hawaiian |
| Minimum | $29,297 | $22,468 |
| Maximum | $69,097 | $62,910 |
| Range | $39,800 | $40,442 |
| Mean | $45,169 | $42,021 |
| Median | $45,280 | $42,485 |
| Interquartile 25% (IQ1) | $38,744 | $36,941 |
| Interquartile 75% (IQ3) | $50,961 | $46,349 |
| Interquartile Range (IQR) | $12,217 | $9,407 |
| Standard Deviation (Sample) | $8,556 | $7,647 |
| Standard Deviation (Population) | $8,475 | $7,613 |
Demographics Similar to Immigrants from Cabo Verde and Native Hawaiians by Median Earnings
In terms of median earnings, the demographic groups most similar to Immigrants from Cabo Verde are Immigrants from West Indies ($43,989, a difference of 0.060%), Immigrants from Burma/Myanmar ($43,998, a difference of 0.080%), Subsaharan African ($44,118, a difference of 0.35%), Nonimmigrants ($44,117, a difference of 0.35%), and Immigrants from Venezuela ($44,163, a difference of 0.45%). Similarly, the demographic groups most similar to Native Hawaiians are Immigrants from Iraq ($44,988, a difference of 0.090%), Scotch-Irish ($44,924, a difference of 0.23%), Immigrants from Western Africa ($44,893, a difference of 0.30%), Japanese ($44,825, a difference of 0.45%), and Delaware ($44,783, a difference of 0.54%).
| Demographics | Rating | Rank | Median Earnings |
| Native Hawaiians | 12.2 /100 | #227 | Poor $45,027 |
| Immigrants | Iraq | 11.6 /100 | #228 | Poor $44,988 |
| Scotch-Irish | 10.7 /100 | #229 | Poor $44,924 |
| Immigrants | Western Africa | 10.3 /100 | #230 | Poor $44,893 |
| Japanese | 9.5 /100 | #231 | Tragic $44,825 |
| Delaware | 9.0 /100 | #232 | Tragic $44,783 |
| Immigrants | Sudan | 8.8 /100 | #233 | Tragic $44,767 |
| Cape Verdeans | 7.5 /100 | #234 | Tragic $44,640 |
| Venezuelans | 6.9 /100 | #235 | Tragic $44,580 |
| British West Indians | 6.7 /100 | #236 | Tragic $44,552 |
| Immigrants | Ecuador | 5.9 /100 | #237 | Tragic $44,462 |
| Sudanese | 5.6 /100 | #238 | Tragic $44,419 |
| Senegalese | 5.3 /100 | #239 | Tragic $44,373 |
| Aleuts | 4.4 /100 | #240 | Tragic $44,241 |
| Samoans | 4.2 /100 | #241 | Tragic $44,206 |
| Immigrants | Venezuela | 4.0 /100 | #242 | Tragic $44,163 |
| Sub-Saharan Africans | 3.7 /100 | #243 | Tragic $44,118 |
| Immigrants | Nonimmigrants | 3.7 /100 | #244 | Tragic $44,117 |
| Immigrants | Burma/Myanmar | 3.2 /100 | #245 | Tragic $43,998 |
| Immigrants | West Indies | 3.1 /100 | #246 | Tragic $43,989 |
| Immigrants | Cabo Verde | 3.0 /100 | #247 | Tragic $43,963 |