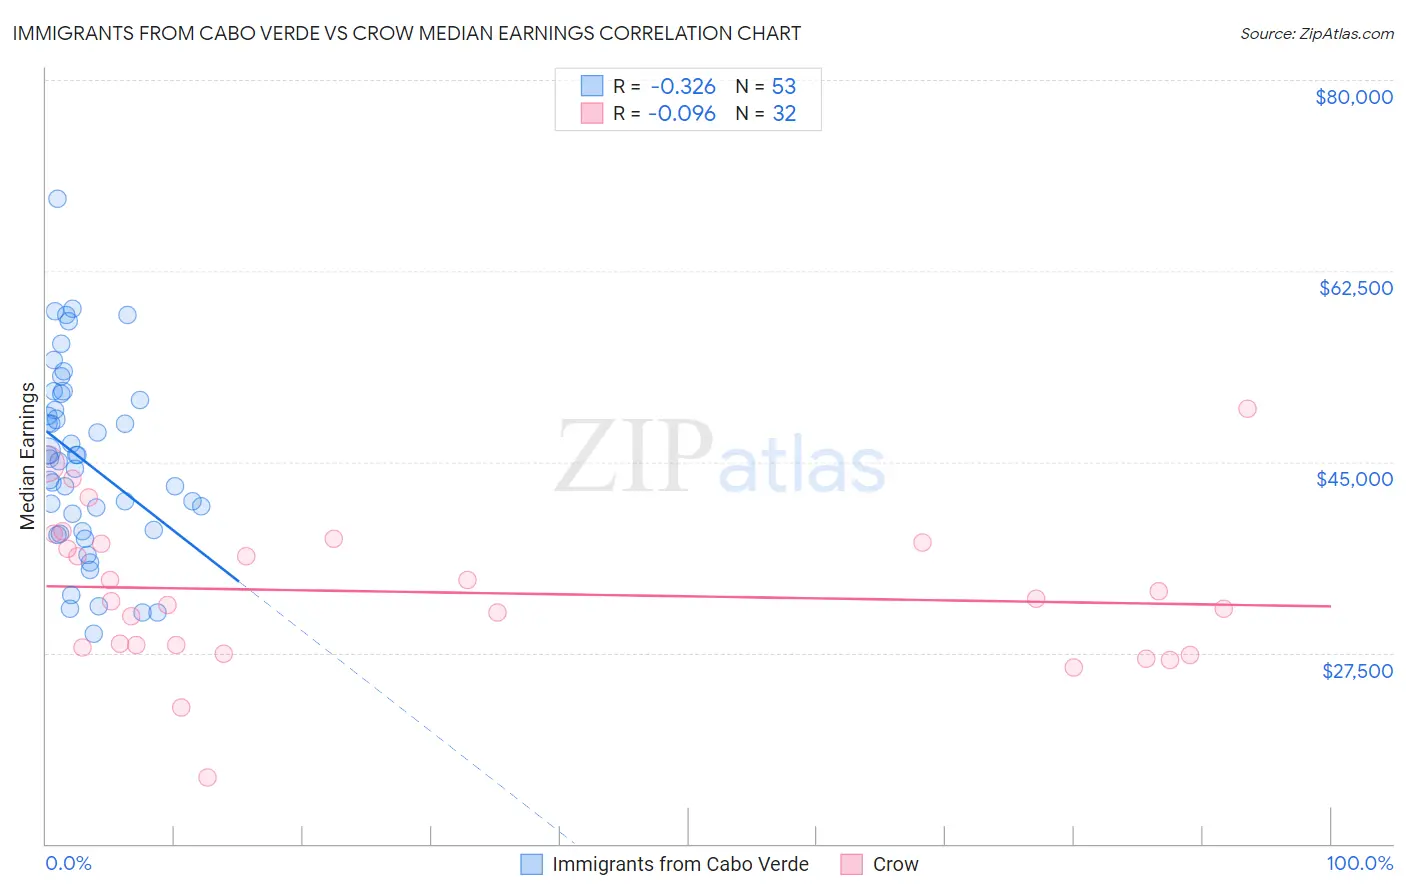
Immigrants from Cabo Verde vs Crow Median Earnings
COMPARE
Immigrants from Cabo Verde
Crow
Median Earnings
Median Earnings Comparison
Immigrants from Cabo Verde
Crow
$43,963
MEDIAN EARNINGS
3.0/ 100
METRIC RATING
247th/ 347
METRIC RANK
$38,707
MEDIAN EARNINGS
0.0/ 100
METRIC RATING
336th/ 347
METRIC RANK
Immigrants from Cabo Verde vs Crow Median Earnings Correlation Chart
The statistical analysis conducted on geographies consisting of 38,158,666 people shows a mild negative correlation between the proportion of Immigrants from Cabo Verde and median earnings in the United States with a correlation coefficient (R) of -0.326 and weighted average of $43,963. Similarly, the statistical analysis conducted on geographies consisting of 59,204,148 people shows a slight negative correlation between the proportion of Crow and median earnings in the United States with a correlation coefficient (R) of -0.096 and weighted average of $38,707, a difference of 13.6%.
Median Earnings Correlation Summary
| Measurement | Immigrants from Cabo Verde | Crow |
| Minimum | $29,297 | $16,094 |
| Maximum | $69,097 | $49,926 |
| Range | $39,800 | $33,832 |
| Mean | $45,169 | $33,045 |
| Median | $45,280 | $32,361 |
| Interquartile 25% (IQ1) | $38,744 | $28,093 |
| Interquartile 75% (IQ3) | $50,961 | $37,549 |
| Interquartile Range (IQR) | $12,217 | $9,456 |
| Standard Deviation (Sample) | $8,556 | $6,875 |
| Standard Deviation (Population) | $8,475 | $6,767 |
Similar Demographics by Median Earnings
Demographics Similar to Immigrants from Cabo Verde by Median Earnings
In terms of median earnings, the demographic groups most similar to Immigrants from Cabo Verde are Immigrants from West Indies ($43,989, a difference of 0.060%), Immigrants from Burma/Myanmar ($43,998, a difference of 0.080%), Nepalese ($43,860, a difference of 0.24%), Malaysian ($43,844, a difference of 0.27%), and Subsaharan African ($44,118, a difference of 0.35%).
| Demographics | Rating | Rank | Median Earnings |
| Aleuts | 4.4 /100 | #240 | Tragic $44,241 |
| Samoans | 4.2 /100 | #241 | Tragic $44,206 |
| Immigrants | Venezuela | 4.0 /100 | #242 | Tragic $44,163 |
| Sub-Saharan Africans | 3.7 /100 | #243 | Tragic $44,118 |
| Immigrants | Nonimmigrants | 3.7 /100 | #244 | Tragic $44,117 |
| Immigrants | Burma/Myanmar | 3.2 /100 | #245 | Tragic $43,998 |
| Immigrants | West Indies | 3.1 /100 | #246 | Tragic $43,989 |
| Immigrants | Cabo Verde | 3.0 /100 | #247 | Tragic $43,963 |
| Nepalese | 2.6 /100 | #248 | Tragic $43,860 |
| Malaysians | 2.6 /100 | #249 | Tragic $43,844 |
| Alaska Natives | 2.3 /100 | #250 | Tragic $43,750 |
| Tsimshian | 2.1 /100 | #251 | Tragic $43,695 |
| Hawaiians | 2.0 /100 | #252 | Tragic $43,673 |
| Somalis | 1.8 /100 | #253 | Tragic $43,567 |
| Liberians | 1.7 /100 | #254 | Tragic $43,536 |
Demographics Similar to Crow by Median Earnings
In terms of median earnings, the demographic groups most similar to Crow are Native/Alaskan ($38,896, a difference of 0.49%), Spanish American Indian ($38,907, a difference of 0.52%), Houma ($38,949, a difference of 0.62%), Immigrants from Cuba ($38,426, a difference of 0.73%), and Yakama ($39,107, a difference of 1.0%).
| Demographics | Rating | Rank | Median Earnings |
| Kiowa | 0.0 /100 | #329 | Tragic $39,232 |
| Immigrants | Congo | 0.0 /100 | #330 | Tragic $39,169 |
| Immigrants | Mexico | 0.0 /100 | #331 | Tragic $39,114 |
| Yakama | 0.0 /100 | #332 | Tragic $39,107 |
| Houma | 0.0 /100 | #333 | Tragic $38,949 |
| Spanish American Indians | 0.0 /100 | #334 | Tragic $38,907 |
| Natives/Alaskans | 0.0 /100 | #335 | Tragic $38,896 |
| Crow | 0.0 /100 | #336 | Tragic $38,707 |
| Immigrants | Cuba | 0.0 /100 | #337 | Tragic $38,426 |
| Pima | 0.0 /100 | #338 | Tragic $38,285 |
| Menominee | 0.0 /100 | #339 | Tragic $37,884 |
| Navajo | 0.0 /100 | #340 | Tragic $36,999 |
| Lumbee | 0.0 /100 | #341 | Tragic $36,876 |
| Hopi | 0.0 /100 | #342 | Tragic $36,871 |
| Pueblo | 0.0 /100 | #343 | Tragic $36,859 |