Immigrants from Cabo Verde vs Immigrants from Yemen Median Earnings
COMPARE
Immigrants from Cabo Verde
Immigrants from Yemen
Median Earnings
Median Earnings Comparison
Immigrants from Cabo Verde
Immigrants from Yemen
$43,963
MEDIAN EARNINGS
3.0/ 100
METRIC RATING
247th/ 347
METRIC RANK
$39,540
MEDIAN EARNINGS
0.0/ 100
METRIC RATING
326th/ 347
METRIC RANK
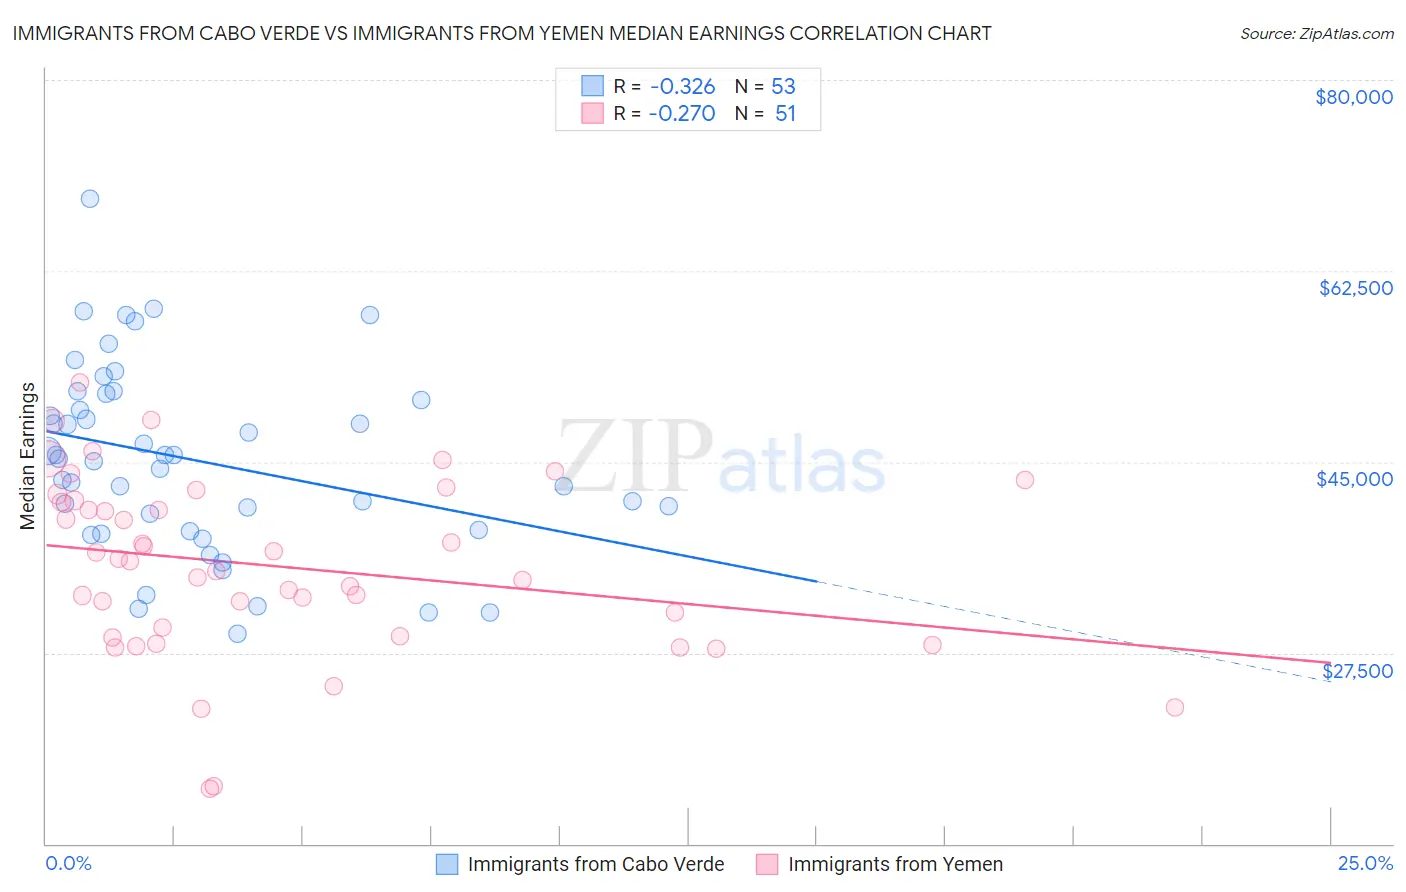
Immigrants from Cabo Verde vs Immigrants from Yemen Median Earnings Correlation Chart
The statistical analysis conducted on geographies consisting of 38,158,666 people shows a mild negative correlation between the proportion of Immigrants from Cabo Verde and median earnings in the United States with a correlation coefficient (R) of -0.326 and weighted average of $43,963. Similarly, the statistical analysis conducted on geographies consisting of 82,433,611 people shows a weak negative correlation between the proportion of Immigrants from Yemen and median earnings in the United States with a correlation coefficient (R) of -0.270 and weighted average of $39,540, a difference of 11.2%.
Median Earnings Correlation Summary
| Measurement | Immigrants from Cabo Verde | Immigrants from Yemen |
| Minimum | $29,297 | $15,000 |
| Maximum | $69,097 | $52,299 |
| Range | $39,800 | $37,299 |
| Mean | $45,169 | $35,429 |
| Median | $45,280 | $35,934 |
| Interquartile 25% (IQ1) | $38,744 | $29,005 |
| Interquartile 75% (IQ3) | $50,961 | $41,449 |
| Interquartile Range (IQR) | $12,217 | $12,444 |
| Standard Deviation (Sample) | $8,556 | $8,118 |
| Standard Deviation (Population) | $8,475 | $8,038 |
Similar Demographics by Median Earnings
Demographics Similar to Immigrants from Cabo Verde by Median Earnings
In terms of median earnings, the demographic groups most similar to Immigrants from Cabo Verde are Immigrants from West Indies ($43,989, a difference of 0.060%), Immigrants from Burma/Myanmar ($43,998, a difference of 0.080%), Nepalese ($43,860, a difference of 0.24%), Malaysian ($43,844, a difference of 0.27%), and Subsaharan African ($44,118, a difference of 0.35%).
| Demographics | Rating | Rank | Median Earnings |
| Aleuts | 4.4 /100 | #240 | Tragic $44,241 |
| Samoans | 4.2 /100 | #241 | Tragic $44,206 |
| Immigrants | Venezuela | 4.0 /100 | #242 | Tragic $44,163 |
| Sub-Saharan Africans | 3.7 /100 | #243 | Tragic $44,118 |
| Immigrants | Nonimmigrants | 3.7 /100 | #244 | Tragic $44,117 |
| Immigrants | Burma/Myanmar | 3.2 /100 | #245 | Tragic $43,998 |
| Immigrants | West Indies | 3.1 /100 | #246 | Tragic $43,989 |
| Immigrants | Cabo Verde | 3.0 /100 | #247 | Tragic $43,963 |
| Nepalese | 2.6 /100 | #248 | Tragic $43,860 |
| Malaysians | 2.6 /100 | #249 | Tragic $43,844 |
| Alaska Natives | 2.3 /100 | #250 | Tragic $43,750 |
| Tsimshian | 2.1 /100 | #251 | Tragic $43,695 |
| Hawaiians | 2.0 /100 | #252 | Tragic $43,673 |
| Somalis | 1.8 /100 | #253 | Tragic $43,567 |
| Liberians | 1.7 /100 | #254 | Tragic $43,536 |
Demographics Similar to Immigrants from Yemen by Median Earnings
In terms of median earnings, the demographic groups most similar to Immigrants from Yemen are Yuman ($39,523, a difference of 0.040%), Sioux ($39,448, a difference of 0.23%), Creek ($39,648, a difference of 0.27%), Ottawa ($39,721, a difference of 0.46%), and Bahamian ($39,735, a difference of 0.49%).
| Demographics | Rating | Rank | Median Earnings |
| Blacks/African Americans | 0.0 /100 | #319 | Tragic $40,085 |
| Immigrants | Bahamas | 0.0 /100 | #320 | Tragic $39,861 |
| Mexicans | 0.0 /100 | #321 | Tragic $39,834 |
| Immigrants | Central America | 0.0 /100 | #322 | Tragic $39,762 |
| Bahamians | 0.0 /100 | #323 | Tragic $39,735 |
| Ottawa | 0.0 /100 | #324 | Tragic $39,721 |
| Creek | 0.0 /100 | #325 | Tragic $39,648 |
| Immigrants | Yemen | 0.0 /100 | #326 | Tragic $39,540 |
| Yuman | 0.0 /100 | #327 | Tragic $39,523 |
| Sioux | 0.0 /100 | #328 | Tragic $39,448 |
| Kiowa | 0.0 /100 | #329 | Tragic $39,232 |
| Immigrants | Congo | 0.0 /100 | #330 | Tragic $39,169 |
| Immigrants | Mexico | 0.0 /100 | #331 | Tragic $39,114 |
| Yakama | 0.0 /100 | #332 | Tragic $39,107 |
| Houma | 0.0 /100 | #333 | Tragic $38,949 |