Immigrants from Cabo Verde vs Egyptian Median Earnings
COMPARE
Immigrants from Cabo Verde
Egyptian
Median Earnings
Median Earnings Comparison
Immigrants from Cabo Verde
Egyptians
$43,963
MEDIAN EARNINGS
3.0/ 100
METRIC RATING
247th/ 347
METRIC RANK
$51,701
MEDIAN EARNINGS
99.9/ 100
METRIC RATING
55th/ 347
METRIC RANK
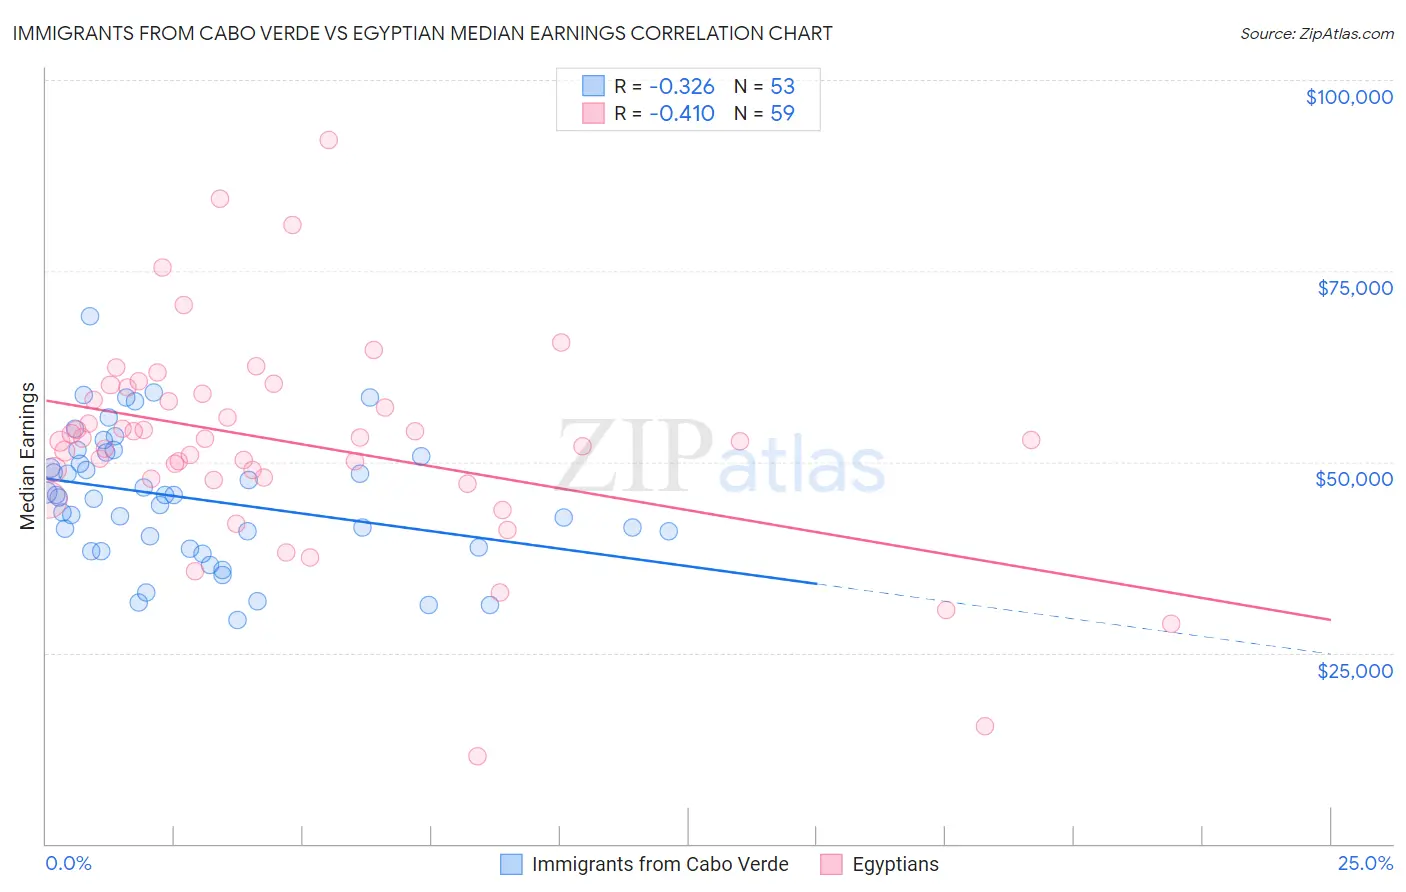
Immigrants from Cabo Verde vs Egyptian Median Earnings Correlation Chart
The statistical analysis conducted on geographies consisting of 38,158,666 people shows a mild negative correlation between the proportion of Immigrants from Cabo Verde and median earnings in the United States with a correlation coefficient (R) of -0.326 and weighted average of $43,963. Similarly, the statistical analysis conducted on geographies consisting of 276,931,355 people shows a moderate negative correlation between the proportion of Egyptians and median earnings in the United States with a correlation coefficient (R) of -0.410 and weighted average of $51,701, a difference of 17.6%.
Median Earnings Correlation Summary
| Measurement | Immigrants from Cabo Verde | Egyptian |
| Minimum | $29,297 | $11,442 |
| Maximum | $69,097 | $92,200 |
| Range | $39,800 | $80,758 |
| Mean | $45,169 | $52,434 |
| Median | $45,280 | $52,906 |
| Interquartile 25% (IQ1) | $38,744 | $47,712 |
| Interquartile 75% (IQ3) | $50,961 | $58,933 |
| Interquartile Range (IQR) | $12,217 | $11,221 |
| Standard Deviation (Sample) | $8,556 | $13,766 |
| Standard Deviation (Population) | $8,475 | $13,649 |
Similar Demographics by Median Earnings
Demographics Similar to Immigrants from Cabo Verde by Median Earnings
In terms of median earnings, the demographic groups most similar to Immigrants from Cabo Verde are Immigrants from West Indies ($43,989, a difference of 0.060%), Immigrants from Burma/Myanmar ($43,998, a difference of 0.080%), Nepalese ($43,860, a difference of 0.24%), Malaysian ($43,844, a difference of 0.27%), and Subsaharan African ($44,118, a difference of 0.35%).
| Demographics | Rating | Rank | Median Earnings |
| Aleuts | 4.4 /100 | #240 | Tragic $44,241 |
| Samoans | 4.2 /100 | #241 | Tragic $44,206 |
| Immigrants | Venezuela | 4.0 /100 | #242 | Tragic $44,163 |
| Sub-Saharan Africans | 3.7 /100 | #243 | Tragic $44,118 |
| Immigrants | Nonimmigrants | 3.7 /100 | #244 | Tragic $44,117 |
| Immigrants | Burma/Myanmar | 3.2 /100 | #245 | Tragic $43,998 |
| Immigrants | West Indies | 3.1 /100 | #246 | Tragic $43,989 |
| Immigrants | Cabo Verde | 3.0 /100 | #247 | Tragic $43,963 |
| Nepalese | 2.6 /100 | #248 | Tragic $43,860 |
| Malaysians | 2.6 /100 | #249 | Tragic $43,844 |
| Alaska Natives | 2.3 /100 | #250 | Tragic $43,750 |
| Tsimshian | 2.1 /100 | #251 | Tragic $43,695 |
| Hawaiians | 2.0 /100 | #252 | Tragic $43,673 |
| Somalis | 1.8 /100 | #253 | Tragic $43,567 |
| Liberians | 1.7 /100 | #254 | Tragic $43,536 |
Demographics Similar to Egyptians by Median Earnings
In terms of median earnings, the demographic groups most similar to Egyptians are Immigrants from Pakistan ($51,693, a difference of 0.010%), Immigrants from Indonesia ($51,715, a difference of 0.030%), Immigrants from Norway ($51,758, a difference of 0.11%), Estonian ($51,772, a difference of 0.14%), and Immigrants from Eastern Europe ($51,624, a difference of 0.15%).
| Demographics | Rating | Rank | Median Earnings |
| Immigrants | Europe | 100.0 /100 | #48 | Exceptional $52,195 |
| Bolivians | 100.0 /100 | #49 | Exceptional $52,005 |
| Immigrants | South Africa | 100.0 /100 | #50 | Exceptional $51,850 |
| Immigrants | Austria | 99.9 /100 | #51 | Exceptional $51,826 |
| Estonians | 99.9 /100 | #52 | Exceptional $51,772 |
| Immigrants | Norway | 99.9 /100 | #53 | Exceptional $51,758 |
| Immigrants | Indonesia | 99.9 /100 | #54 | Exceptional $51,715 |
| Egyptians | 99.9 /100 | #55 | Exceptional $51,701 |
| Immigrants | Pakistan | 99.9 /100 | #56 | Exceptional $51,693 |
| Immigrants | Eastern Europe | 99.9 /100 | #57 | Exceptional $51,624 |
| Immigrants | Bolivia | 99.9 /100 | #58 | Exceptional $51,605 |
| Immigrants | Croatia | 99.9 /100 | #59 | Exceptional $51,581 |
| Immigrants | Serbia | 99.9 /100 | #60 | Exceptional $51,557 |
| Immigrants | Latvia | 99.9 /100 | #61 | Exceptional $51,555 |
| Immigrants | Romania | 99.9 /100 | #62 | Exceptional $51,337 |