Immigrants from Cabo Verde vs Native Hawaiian Male Poverty
COMPARE
Immigrants from Cabo Verde
Native Hawaiian
Male Poverty
Male Poverty Comparison
Immigrants from Cabo Verde
Native Hawaiians
13.7%
MALE POVERTY
0.0/ 100
METRIC RATING
282nd/ 347
METRIC RANK
10.7%
MALE POVERTY
87.0/ 100
METRIC RATING
122nd/ 347
METRIC RANK
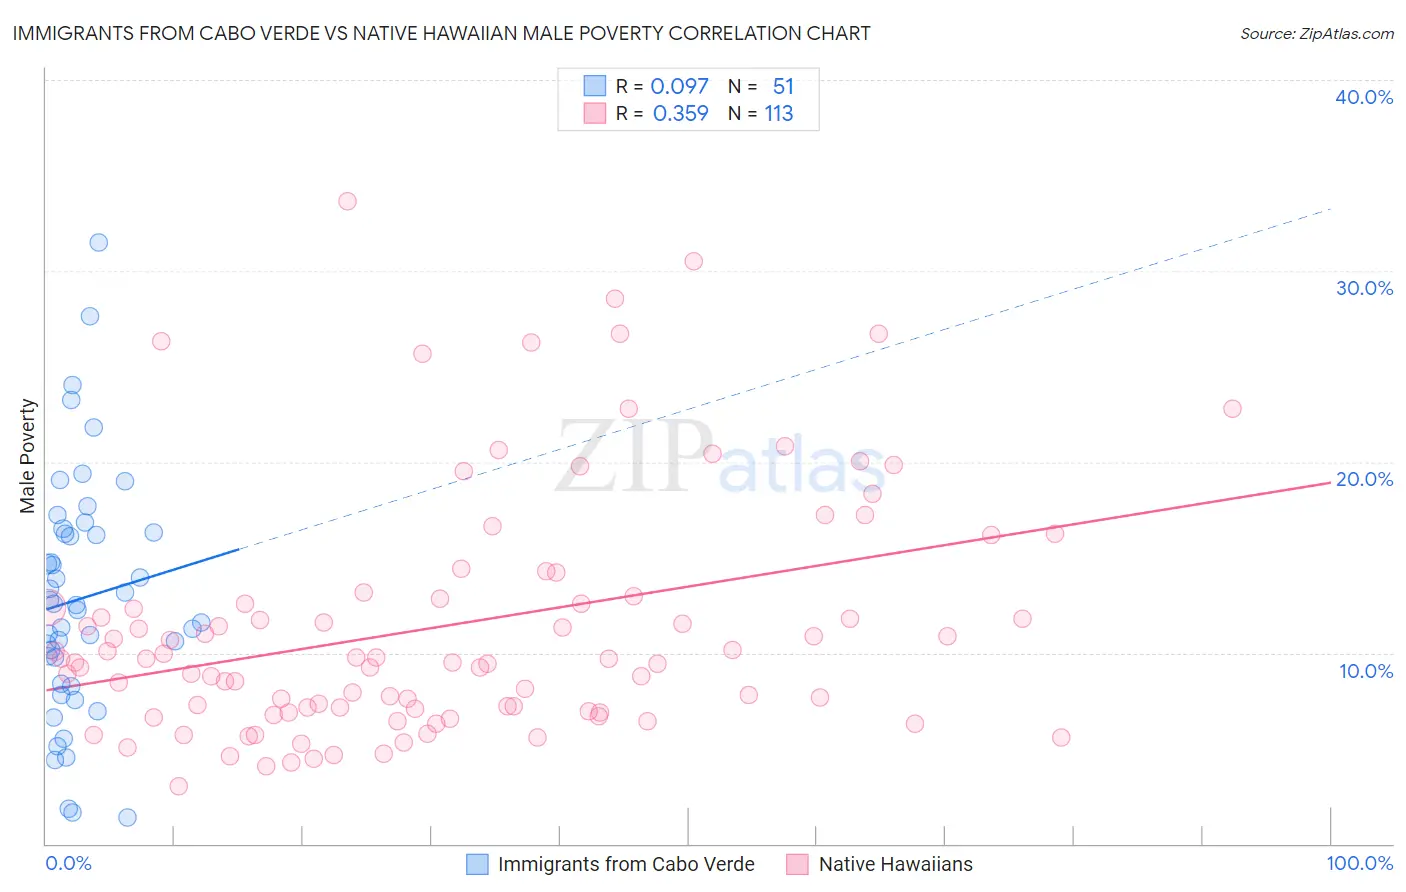
Immigrants from Cabo Verde vs Native Hawaiian Male Poverty Correlation Chart
The statistical analysis conducted on geographies consisting of 38,133,137 people shows a slight positive correlation between the proportion of Immigrants from Cabo Verde and poverty level among males in the United States with a correlation coefficient (R) of 0.097 and weighted average of 13.7%. Similarly, the statistical analysis conducted on geographies consisting of 331,823,706 people shows a mild positive correlation between the proportion of Native Hawaiians and poverty level among males in the United States with a correlation coefficient (R) of 0.359 and weighted average of 10.7%, a difference of 28.7%.
Male Poverty Correlation Summary
| Measurement | Immigrants from Cabo Verde | Native Hawaiian |
| Minimum | 1.4% | 3.0% |
| Maximum | 31.5% | 33.7% |
| Range | 30.1% | 30.7% |
| Mean | 12.8% | 11.4% |
| Median | 12.5% | 9.7% |
| Interquartile 25% (IQ1) | 8.4% | 7.0% |
| Interquartile 75% (IQ3) | 16.3% | 12.9% |
| Interquartile Range (IQR) | 7.9% | 5.9% |
| Standard Deviation (Sample) | 6.3% | 6.4% |
| Standard Deviation (Population) | 6.2% | 6.4% |
Similar Demographics by Male Poverty
Demographics Similar to Immigrants from Cabo Verde by Male Poverty
In terms of male poverty, the demographic groups most similar to Immigrants from Cabo Verde are Comanche (13.8%, a difference of 0.20%), Immigrants from Haiti (13.8%, a difference of 0.21%), West Indian (13.8%, a difference of 0.23%), Shoshone (13.8%, a difference of 0.26%), and Yaqui (13.7%, a difference of 0.27%).
| Demographics | Rating | Rank | Male Poverty |
| Barbadians | 0.0 /100 | #275 | Tragic 13.6% |
| Immigrants | Latin America | 0.0 /100 | #276 | Tragic 13.6% |
| Bangladeshis | 0.0 /100 | #277 | Tragic 13.6% |
| Belizeans | 0.0 /100 | #278 | Tragic 13.6% |
| Haitians | 0.0 /100 | #279 | Tragic 13.7% |
| Mexicans | 0.0 /100 | #280 | Tragic 13.7% |
| Yaqui | 0.0 /100 | #281 | Tragic 13.7% |
| Immigrants | Cabo Verde | 0.0 /100 | #282 | Tragic 13.7% |
| Comanche | 0.0 /100 | #283 | Tragic 13.8% |
| Immigrants | Haiti | 0.0 /100 | #284 | Tragic 13.8% |
| West Indians | 0.0 /100 | #285 | Tragic 13.8% |
| Shoshone | 0.0 /100 | #286 | Tragic 13.8% |
| Immigrants | Barbados | 0.0 /100 | #287 | Tragic 13.8% |
| Immigrants | St. Vincent and the Grenadines | 0.0 /100 | #288 | Tragic 13.8% |
| Guatemalans | 0.0 /100 | #289 | Tragic 13.8% |
Demographics Similar to Native Hawaiians by Male Poverty
In terms of male poverty, the demographic groups most similar to Native Hawaiians are Peruvian (10.7%, a difference of 0.020%), Immigrants from China (10.7%, a difference of 0.030%), South African (10.7%, a difference of 0.040%), French (10.7%, a difference of 0.070%), and Immigrants from Hungary (10.7%, a difference of 0.13%).
| Demographics | Rating | Rank | Male Poverty |
| Immigrants | Russia | 88.6 /100 | #115 | Excellent 10.6% |
| Sri Lankans | 88.1 /100 | #116 | Excellent 10.6% |
| Immigrants | South Eastern Asia | 88.1 /100 | #117 | Excellent 10.6% |
| Okinawans | 87.6 /100 | #118 | Excellent 10.7% |
| Immigrants | Hungary | 87.6 /100 | #119 | Excellent 10.7% |
| Immigrants | China | 87.1 /100 | #120 | Excellent 10.7% |
| Peruvians | 87.1 /100 | #121 | Excellent 10.7% |
| Native Hawaiians | 87.0 /100 | #122 | Excellent 10.7% |
| South Africans | 86.8 /100 | #123 | Excellent 10.7% |
| French | 86.7 /100 | #124 | Excellent 10.7% |
| Immigrants | Norway | 86.0 /100 | #125 | Excellent 10.7% |
| Immigrants | Ukraine | 84.3 /100 | #126 | Excellent 10.7% |
| Puget Sound Salish | 84.3 /100 | #127 | Excellent 10.7% |
| Immigrants | Western Europe | 84.2 /100 | #128 | Excellent 10.7% |
| Immigrants | Peru | 84.1 /100 | #129 | Excellent 10.7% |