Immigrants from St. Vincent and the Grenadines vs Native Hawaiian Median Earnings
COMPARE
Immigrants from St. Vincent and the Grenadines
Native Hawaiian
Median Earnings
Median Earnings Comparison
Immigrants from St. Vincent and the Grenadines
Native Hawaiians
$45,908
MEDIAN EARNINGS
32.4/ 100
METRIC RATING
195th/ 347
METRIC RANK
$45,027
MEDIAN EARNINGS
12.2/ 100
METRIC RATING
227th/ 347
METRIC RANK
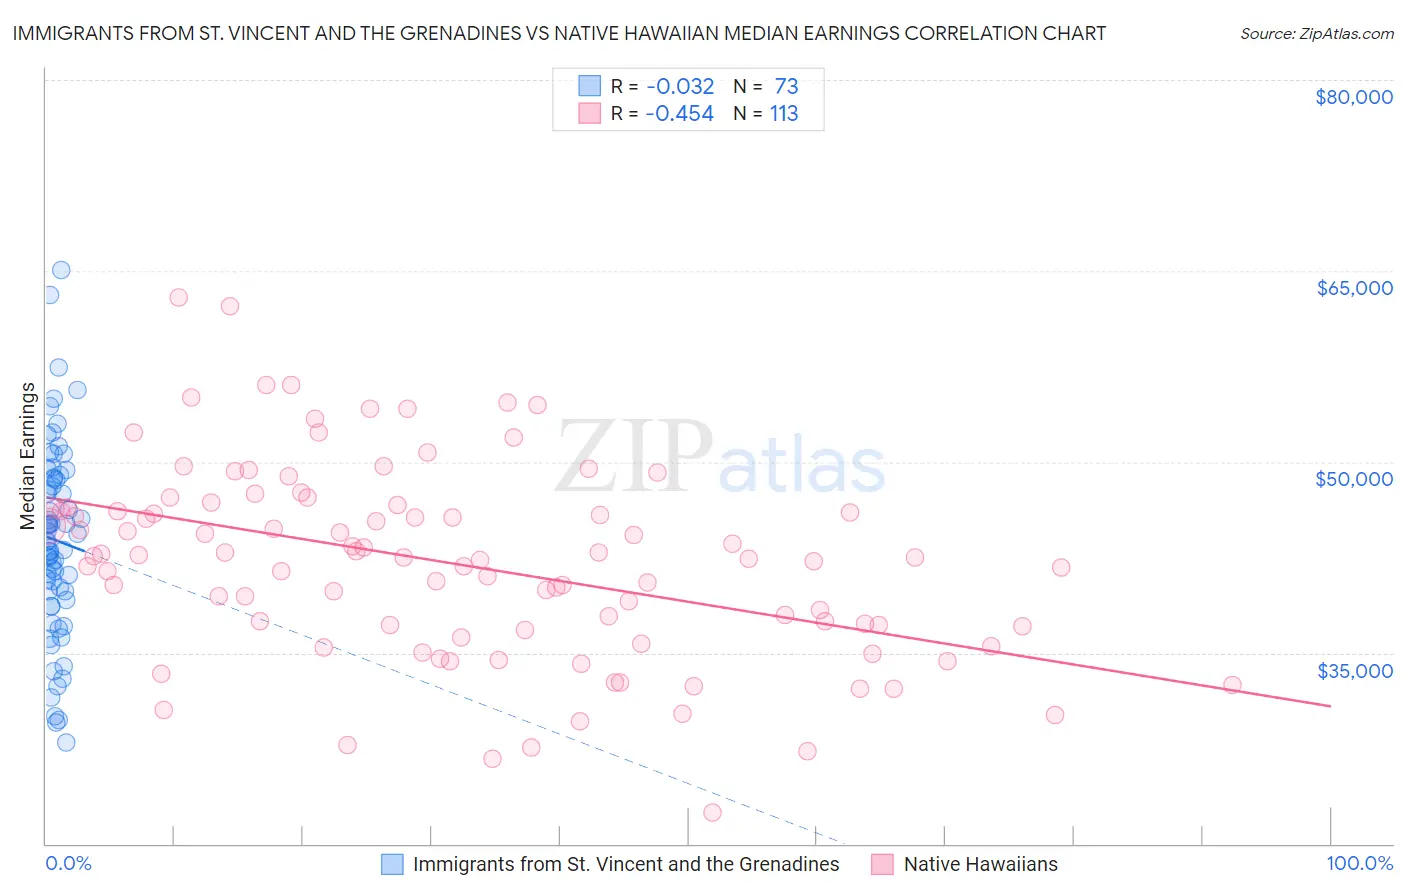
Immigrants from St. Vincent and the Grenadines vs Native Hawaiian Median Earnings Correlation Chart
The statistical analysis conducted on geographies consisting of 56,194,678 people shows no correlation between the proportion of Immigrants from St. Vincent and the Grenadines and median earnings in the United States with a correlation coefficient (R) of -0.032 and weighted average of $45,908. Similarly, the statistical analysis conducted on geographies consisting of 332,103,903 people shows a moderate negative correlation between the proportion of Native Hawaiians and median earnings in the United States with a correlation coefficient (R) of -0.454 and weighted average of $45,027, a difference of 2.0%.
Median Earnings Correlation Summary
| Measurement | Immigrants from St. Vincent and the Grenadines | Native Hawaiian |
| Minimum | $27,951 | $22,468 |
| Maximum | $65,069 | $62,910 |
| Range | $37,118 | $40,442 |
| Mean | $43,851 | $42,021 |
| Median | $43,770 | $42,485 |
| Interquartile 25% (IQ1) | $39,492 | $36,941 |
| Interquartile 75% (IQ3) | $48,733 | $46,349 |
| Interquartile Range (IQR) | $9,241 | $9,407 |
| Standard Deviation (Sample) | $7,478 | $7,647 |
| Standard Deviation (Population) | $7,427 | $7,613 |
Similar Demographics by Median Earnings
Demographics Similar to Immigrants from St. Vincent and the Grenadines by Median Earnings
In terms of median earnings, the demographic groups most similar to Immigrants from St. Vincent and the Grenadines are Immigrants from Costa Rica ($45,928, a difference of 0.040%), German ($45,935, a difference of 0.060%), Guamanian/Chamorro ($45,933, a difference of 0.060%), Finnish ($45,940, a difference of 0.070%), and Yugoslavian ($45,846, a difference of 0.13%).
| Demographics | Rating | Rank | Median Earnings |
| Immigrants | Armenia | 38.3 /100 | #188 | Fair $46,094 |
| Spaniards | 37.2 /100 | #189 | Fair $46,059 |
| French Canadians | 36.1 /100 | #190 | Fair $46,026 |
| Finns | 33.4 /100 | #191 | Fair $45,940 |
| Germans | 33.2 /100 | #192 | Fair $45,935 |
| Guamanians/Chamorros | 33.2 /100 | #193 | Fair $45,933 |
| Immigrants | Costa Rica | 33.0 /100 | #194 | Fair $45,928 |
| Immigrants | St. Vincent and the Grenadines | 32.4 /100 | #195 | Fair $45,908 |
| Yugoslavians | 30.5 /100 | #196 | Fair $45,846 |
| Barbadians | 30.5 /100 | #197 | Fair $45,846 |
| Trinidadians and Tobagonians | 29.7 /100 | #198 | Fair $45,820 |
| Immigrants | Barbados | 29.6 /100 | #199 | Fair $45,816 |
| Immigrants | Azores | 29.5 /100 | #200 | Fair $45,812 |
| Celtics | 27.2 /100 | #201 | Fair $45,732 |
| Immigrants | Trinidad and Tobago | 27.1 /100 | #202 | Fair $45,729 |
Demographics Similar to Native Hawaiians by Median Earnings
In terms of median earnings, the demographic groups most similar to Native Hawaiians are Immigrants from Nigeria ($45,030, a difference of 0.010%), Immigrants from Iraq ($44,988, a difference of 0.090%), Immigrants from Cambodia ($45,090, a difference of 0.14%), West Indian ($45,132, a difference of 0.23%), and Scotch-Irish ($44,924, a difference of 0.23%).
| Demographics | Rating | Rank | Median Earnings |
| Ecuadorians | 15.3 /100 | #220 | Poor $45,214 |
| Immigrants | Guyana | 15.1 /100 | #221 | Poor $45,204 |
| Immigrants | Panama | 15.0 /100 | #222 | Poor $45,198 |
| Whites/Caucasians | 15.0 /100 | #223 | Poor $45,197 |
| West Indians | 13.9 /100 | #224 | Poor $45,132 |
| Immigrants | Cambodia | 13.2 /100 | #225 | Poor $45,090 |
| Immigrants | Nigeria | 12.2 /100 | #226 | Poor $45,030 |
| Native Hawaiians | 12.2 /100 | #227 | Poor $45,027 |
| Immigrants | Iraq | 11.6 /100 | #228 | Poor $44,988 |
| Scotch-Irish | 10.7 /100 | #229 | Poor $44,924 |
| Immigrants | Western Africa | 10.3 /100 | #230 | Poor $44,893 |
| Japanese | 9.5 /100 | #231 | Tragic $44,825 |
| Delaware | 9.0 /100 | #232 | Tragic $44,783 |
| Immigrants | Sudan | 8.8 /100 | #233 | Tragic $44,767 |
| Cape Verdeans | 7.5 /100 | #234 | Tragic $44,640 |