Immigrants from Korea vs Immigrants from Yemen Median Earnings
COMPARE
Immigrants from Korea
Immigrants from Yemen
Median Earnings
Median Earnings Comparison
Immigrants from Korea
Immigrants from Yemen
$54,530
MEDIAN EARNINGS
100.0/ 100
METRIC RATING
22nd/ 347
METRIC RANK
$39,540
MEDIAN EARNINGS
0.0/ 100
METRIC RATING
326th/ 347
METRIC RANK
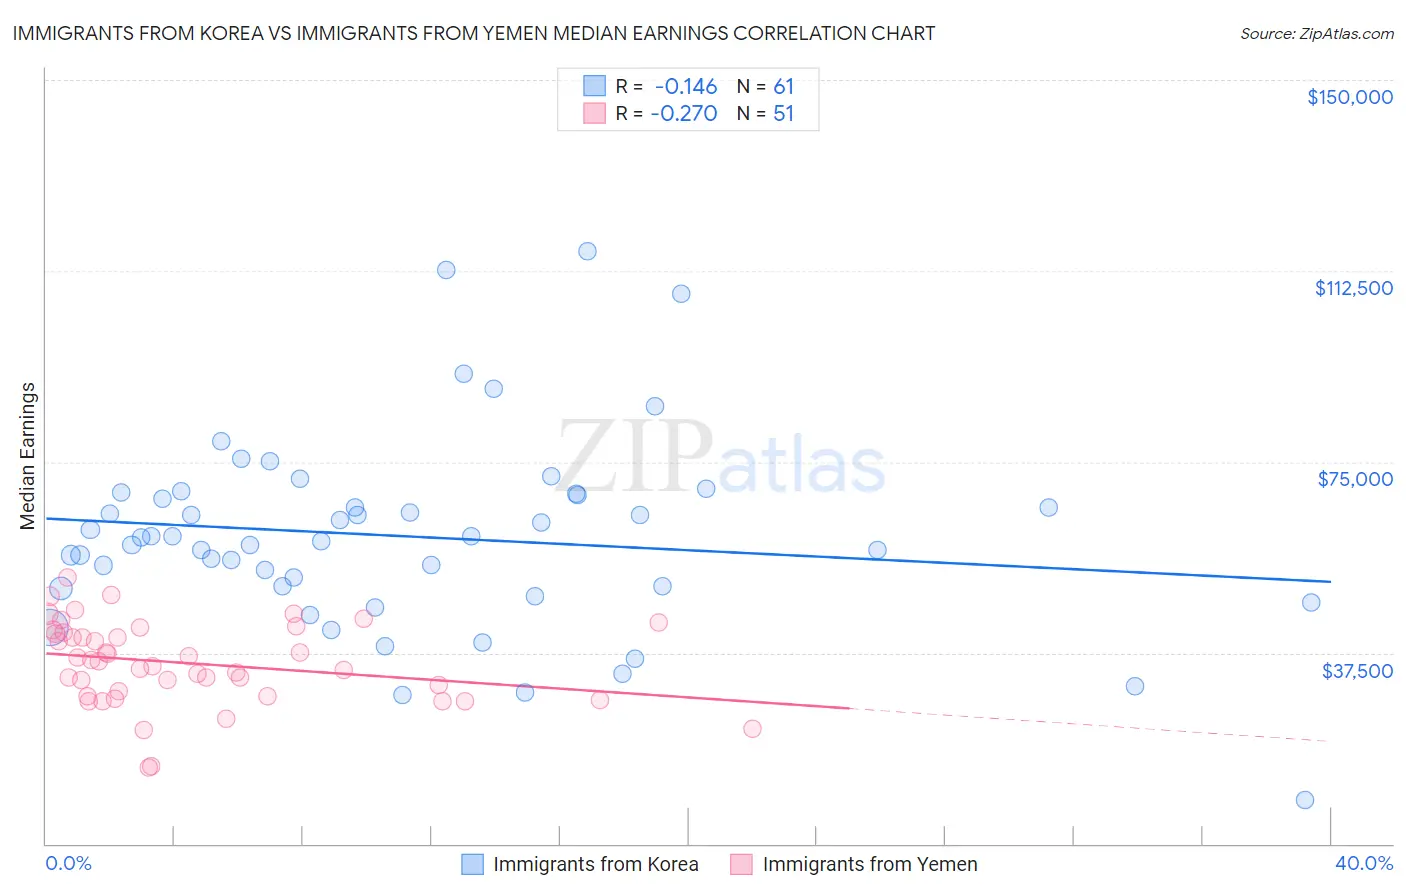
Immigrants from Korea vs Immigrants from Yemen Median Earnings Correlation Chart
The statistical analysis conducted on geographies consisting of 416,330,492 people shows a poor negative correlation between the proportion of Immigrants from Korea and median earnings in the United States with a correlation coefficient (R) of -0.146 and weighted average of $54,530. Similarly, the statistical analysis conducted on geographies consisting of 82,433,611 people shows a weak negative correlation between the proportion of Immigrants from Yemen and median earnings in the United States with a correlation coefficient (R) of -0.270 and weighted average of $39,540, a difference of 37.9%.
Median Earnings Correlation Summary
| Measurement | Immigrants from Korea | Immigrants from Yemen |
| Minimum | $8,707 | $15,000 |
| Maximum | $116,380 | $52,299 |
| Range | $107,673 | $37,299 |
| Mean | $60,321 | $35,429 |
| Median | $60,242 | $35,934 |
| Interquartile 25% (IQ1) | $50,376 | $29,005 |
| Interquartile 75% (IQ3) | $68,586 | $41,449 |
| Interquartile Range (IQR) | $18,211 | $12,444 |
| Standard Deviation (Sample) | $19,123 | $8,118 |
| Standard Deviation (Population) | $18,966 | $8,038 |
Similar Demographics by Median Earnings
Demographics Similar to Immigrants from Korea by Median Earnings
In terms of median earnings, the demographic groups most similar to Immigrants from Korea are Burmese ($54,559, a difference of 0.050%), Immigrants from Sweden ($54,478, a difference of 0.10%), Cypriot ($54,589, a difference of 0.11%), Immigrants from Belgium ($54,679, a difference of 0.27%), and Soviet Union ($54,290, a difference of 0.44%).
| Demographics | Rating | Rank | Median Earnings |
| Indians (Asian) | 100.0 /100 | #15 | Exceptional $56,253 |
| Immigrants | Eastern Asia | 100.0 /100 | #16 | Exceptional $56,183 |
| Eastern Europeans | 100.0 /100 | #17 | Exceptional $55,084 |
| Immigrants | Japan | 100.0 /100 | #18 | Exceptional $54,938 |
| Immigrants | Belgium | 100.0 /100 | #19 | Exceptional $54,679 |
| Cypriots | 100.0 /100 | #20 | Exceptional $54,589 |
| Burmese | 100.0 /100 | #21 | Exceptional $54,559 |
| Immigrants | Korea | 100.0 /100 | #22 | Exceptional $54,530 |
| Immigrants | Sweden | 100.0 /100 | #23 | Exceptional $54,478 |
| Soviet Union | 100.0 /100 | #24 | Exceptional $54,290 |
| Turks | 100.0 /100 | #25 | Exceptional $53,919 |
| Immigrants | Northern Europe | 100.0 /100 | #26 | Exceptional $53,872 |
| Asians | 100.0 /100 | #27 | Exceptional $53,690 |
| Immigrants | France | 100.0 /100 | #28 | Exceptional $53,490 |
| Immigrants | Russia | 100.0 /100 | #29 | Exceptional $53,457 |
Demographics Similar to Immigrants from Yemen by Median Earnings
In terms of median earnings, the demographic groups most similar to Immigrants from Yemen are Yuman ($39,523, a difference of 0.040%), Sioux ($39,448, a difference of 0.23%), Creek ($39,648, a difference of 0.27%), Ottawa ($39,721, a difference of 0.46%), and Bahamian ($39,735, a difference of 0.49%).
| Demographics | Rating | Rank | Median Earnings |
| Blacks/African Americans | 0.0 /100 | #319 | Tragic $40,085 |
| Immigrants | Bahamas | 0.0 /100 | #320 | Tragic $39,861 |
| Mexicans | 0.0 /100 | #321 | Tragic $39,834 |
| Immigrants | Central America | 0.0 /100 | #322 | Tragic $39,762 |
| Bahamians | 0.0 /100 | #323 | Tragic $39,735 |
| Ottawa | 0.0 /100 | #324 | Tragic $39,721 |
| Creek | 0.0 /100 | #325 | Tragic $39,648 |
| Immigrants | Yemen | 0.0 /100 | #326 | Tragic $39,540 |
| Yuman | 0.0 /100 | #327 | Tragic $39,523 |
| Sioux | 0.0 /100 | #328 | Tragic $39,448 |
| Kiowa | 0.0 /100 | #329 | Tragic $39,232 |
| Immigrants | Congo | 0.0 /100 | #330 | Tragic $39,169 |
| Immigrants | Mexico | 0.0 /100 | #331 | Tragic $39,114 |
| Yakama | 0.0 /100 | #332 | Tragic $39,107 |
| Houma | 0.0 /100 | #333 | Tragic $38,949 |