Seminole vs Immigrants from Yemen Median Earnings
COMPARE
Seminole
Immigrants from Yemen
Median Earnings
Median Earnings Comparison
Seminole
Immigrants from Yemen
$40,233
MEDIAN EARNINGS
0.0/ 100
METRIC RATING
315th/ 347
METRIC RANK
$39,540
MEDIAN EARNINGS
0.0/ 100
METRIC RATING
326th/ 347
METRIC RANK
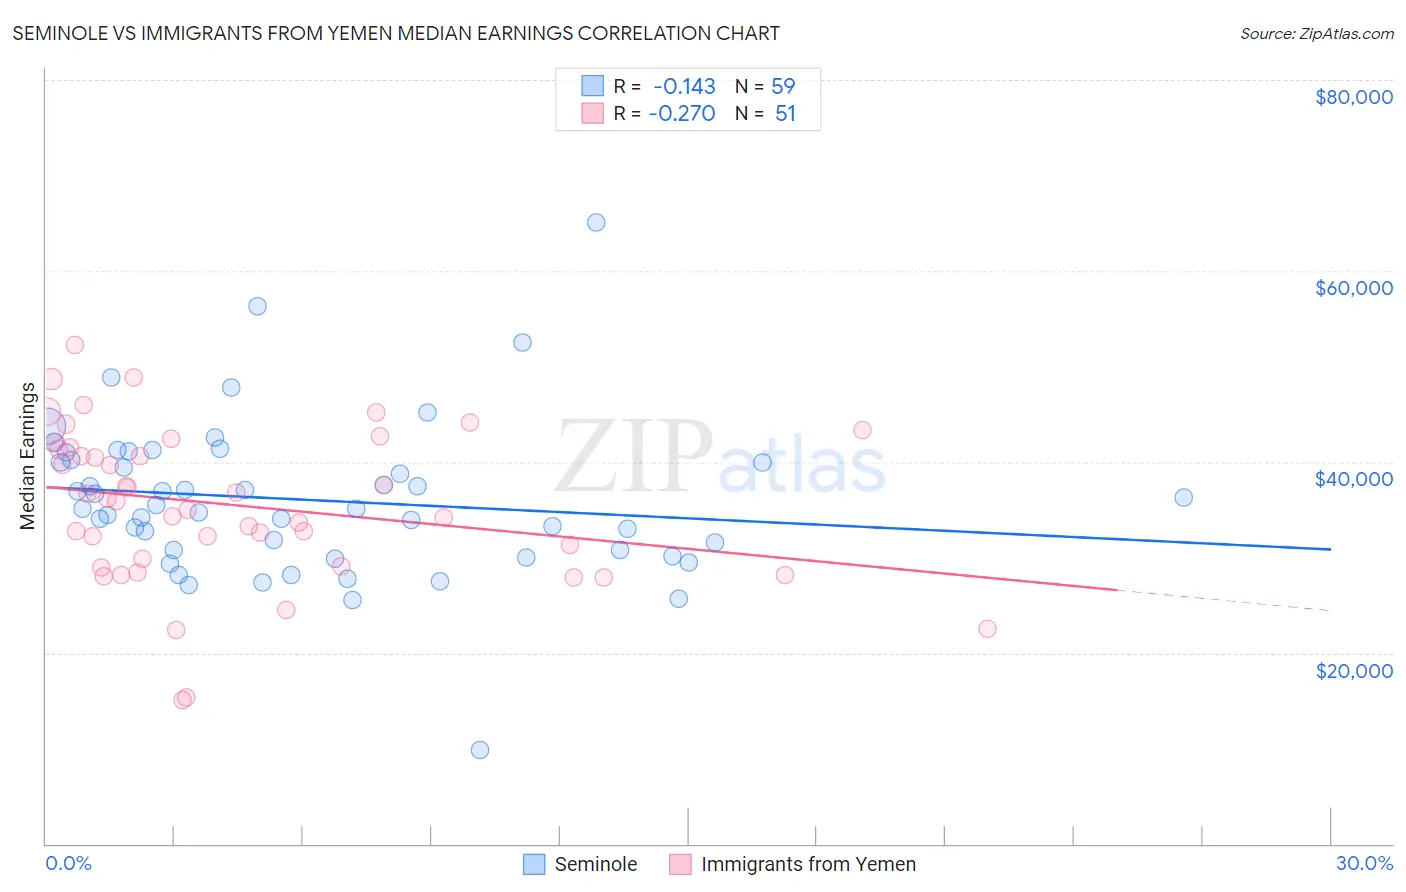
Seminole vs Immigrants from Yemen Median Earnings Correlation Chart
The statistical analysis conducted on geographies consisting of 118,310,048 people shows a poor negative correlation between the proportion of Seminole and median earnings in the United States with a correlation coefficient (R) of -0.143 and weighted average of $40,233. Similarly, the statistical analysis conducted on geographies consisting of 82,433,611 people shows a weak negative correlation between the proportion of Immigrants from Yemen and median earnings in the United States with a correlation coefficient (R) of -0.270 and weighted average of $39,540, a difference of 1.8%.
Median Earnings Correlation Summary
| Measurement | Seminole | Immigrants from Yemen |
| Minimum | $9,817 | $15,000 |
| Maximum | $65,023 | $52,299 |
| Range | $55,206 | $37,299 |
| Mean | $36,018 | $35,429 |
| Median | $35,101 | $35,934 |
| Interquartile 25% (IQ1) | $30,747 | $29,005 |
| Interquartile 75% (IQ3) | $40,152 | $41,449 |
| Interquartile Range (IQR) | $9,405 | $12,444 |
| Standard Deviation (Sample) | $8,228 | $8,118 |
| Standard Deviation (Population) | $8,158 | $8,038 |
Demographics Similar to Seminole and Immigrants from Yemen by Median Earnings
In terms of median earnings, the demographic groups most similar to Seminole are Cheyenne ($40,233, a difference of 0.0%), Choctaw ($40,270, a difference of 0.090%), Immigrants from Honduras ($40,195, a difference of 0.090%), Fijian ($40,193, a difference of 0.10%), and Chippewa ($40,287, a difference of 0.13%). Similarly, the demographic groups most similar to Immigrants from Yemen are Yuman ($39,523, a difference of 0.040%), Sioux ($39,448, a difference of 0.23%), Creek ($39,648, a difference of 0.27%), Ottawa ($39,721, a difference of 0.46%), and Bahamian ($39,735, a difference of 0.49%).
| Demographics | Rating | Rank | Median Earnings |
| Apache | 0.0 /100 | #310 | Tragic $40,388 |
| Hispanics or Latinos | 0.0 /100 | #311 | Tragic $40,288 |
| Chippewa | 0.0 /100 | #312 | Tragic $40,287 |
| Choctaw | 0.0 /100 | #313 | Tragic $40,270 |
| Cheyenne | 0.0 /100 | #314 | Tragic $40,233 |
| Seminole | 0.0 /100 | #315 | Tragic $40,233 |
| Immigrants | Honduras | 0.0 /100 | #316 | Tragic $40,195 |
| Fijians | 0.0 /100 | #317 | Tragic $40,193 |
| Dutch West Indians | 0.0 /100 | #318 | Tragic $40,107 |
| Blacks/African Americans | 0.0 /100 | #319 | Tragic $40,085 |
| Immigrants | Bahamas | 0.0 /100 | #320 | Tragic $39,861 |
| Mexicans | 0.0 /100 | #321 | Tragic $39,834 |
| Immigrants | Central America | 0.0 /100 | #322 | Tragic $39,762 |
| Bahamians | 0.0 /100 | #323 | Tragic $39,735 |
| Ottawa | 0.0 /100 | #324 | Tragic $39,721 |
| Creek | 0.0 /100 | #325 | Tragic $39,648 |
| Immigrants | Yemen | 0.0 /100 | #326 | Tragic $39,540 |
| Yuman | 0.0 /100 | #327 | Tragic $39,523 |
| Sioux | 0.0 /100 | #328 | Tragic $39,448 |
| Kiowa | 0.0 /100 | #329 | Tragic $39,232 |
| Immigrants | Congo | 0.0 /100 | #330 | Tragic $39,169 |