Alsatian vs Immigrants from Iraq Median Male Earnings

COMPARE

Alsatian
Race
Ancestry
AfghanAfricanAlaska NativeAlaskan AthabascanAlbanianAleutAlsatianAmericanApacheArabArapahoArgentineanArmenianAssyrian/Chaldean/SyriacAustralianAustrianBahamianBangladeshiBarbadianBasqueBelgianBelizeanBermudanBhutaneseBlackfeetBolivianBrazilianBritishBritish West IndianBulgarianBurmeseCajunCambodianCanadianCape VerdeanCarpatho RusynCelticCentral AmericanCentral American IndianCherokeeCheyenneChickasawChileanChineseChippewaChoctawColombianColvilleComancheCosta RicanCreeCreekCroatianCrowCubanCypriotCzechCzechoslovakianDanishDelawareDominicanDutchDutch West IndianEastern EuropeanEcuadorianEgyptianEnglishEstonianEthiopianEuropeanFijianFilipinoFinnishFrenchFrench American IndianFrench CanadianGermanGerman RussianGhanaianGreekGuamanian/ChamorroGuatemalanGuyaneseHaitianHmongHonduranHopiHoumaHungarianIcelanderIndian (Asian)IndonesianInupiatIranianIraqiIrishIroquoisIsraeliItalianJamaicanJapaneseJordanianKenyanKiowaKoreanLaotianLatvianLebaneseLiberianLithuanianLumbeeLuxembourgerMacedonianMalaysianMalteseMarshalleseMenomineeMexicanMexican American IndianMongolianMoroccanNative HawaiianNavajoNepaleseNew ZealanderNicaraguanNigerianNorthern EuropeanNorwegianOkinawanOsageOttawaPaiutePakistaniPalestinianPanamanianParaguayanPennsylvania GermanPeruvianPimaPolishPortuguesePotawatomiPuebloPuerto RicanPuget Sound SalishRomanianRussianSalvadoranSamoanScandinavianScotch-IrishScottishSeminoleSenegaleseSerbianShoshoneSierra LeoneanSiouxSlavicSlovakSloveneSomaliSouth AfricanSouth AmericanSouth American IndianSoviet UnionSpaniardSpanishSpanish AmericanSpanish American IndianSri LankanSubsaharan AfricanSudaneseSwedishSwissSyrianTaiwaneseThaiTlingit-HaidaTohono O'OdhamTonganTrinidadian and TobagonianTsimshianTurkishU.S. Virgin IslanderUgandanUkrainianUruguayanUteVenezuelanVietnameseWelshWest IndianYakamaYaquiYugoslavianYumanYup'ikZimbabwean
Immigration
NonimmigrantsImmigrantsAfghanistanAfricaAlbaniaArgentinaArmeniaAsiaAustraliaAustriaBahamasBangladeshBarbadosBelarusBelgiumBelizeBoliviaBosnia and HerzegovinaBrazilBulgariaBurma/MyanmarCabo VerdeCambodiaCameroonCanadaCaribbeanCentral AmericaChileChinaColombiaCongoCosta RicaCroatiaCubaCzechoslovakiaDenmarkDominicaDominican RepublicEastern AfricaEastern AsiaEastern EuropeEcuadorEgyptEl SalvadorEnglandEritreaEthiopiaEuropeFijiFranceGermanyGhanaGreeceGrenadaGuatemalaGuyanaHaitiHondurasHong KongHungaryIndiaIndonesiaIranIrelandIsraelItalyJamaicaJapanJordanKazakhstanKenyaKoreaKuwaitLaosLatin AmericaLatviaLebanonLiberiaLithuaniaMalaysiaMexicoMicronesiaMiddle AfricaMoldovaMoroccoNepalNetherlandsNicaraguaNigeriaNorth AmericaNorth MacedoniaNorthern AfricaNorthern EuropeNorwayOceaniaPakistanPanamaPeruPhilippinesPolandPortugalRomaniaRussiaSaudi ArabiaScotlandSenegalSerbiaSierra LeoneSingaporeSomaliaSouth AfricaSouth AmericaSouth Central AsiaSouth Eastern AsiaSouthern EuropeSpainSri LankaSt. Vincent and the GrenadinesSudanSwedenSwitzerlandSyriaTaiwanThailandTrinidad and TobagoTurkeyUgandaUkraineUruguayUzbekistanVenezuelaVietnamWest IndiesWestern AfricaWestern AsiaWestern EuropeYemenZaireZimbabweAzores
Immigrants from Iraq
Race
Ancestry
AfghanAfricanAlaska NativeAlaskan AthabascanAlbanianAleutAmericanApacheArabArapahoArgentineanArmenianAssyrian/Chaldean/SyriacAustralianAustrianBahamianBangladeshiBarbadianBasqueBelgianBelizeanBermudanBhutaneseBlackfeetBolivianBrazilianBritishBritish West IndianBulgarianBurmeseCajunCambodianCanadianCape VerdeanCarpatho RusynCelticCentral AmericanCentral American IndianCherokeeCheyenneChickasawChileanChineseChippewaChoctawColombianColvilleComancheCosta RicanCreeCreekCroatianCrowCubanCypriotCzechCzechoslovakianDanishDelawareDominicanDutchDutch West IndianEastern EuropeanEcuadorianEgyptianEnglishEstonianEthiopianEuropeanFijianFilipinoFinnishFrenchFrench American IndianFrench CanadianGermanGerman RussianGhanaianGreekGuamanian/ChamorroGuatemalanGuyaneseHaitianHmongHonduranHopiHoumaHungarianIcelanderIndian (Asian)IndonesianInupiatIranianIraqiIrishIroquoisIsraeliItalianJamaicanJapaneseJordanianKenyanKiowaKoreanLaotianLatvianLebaneseLiberianLithuanianLumbeeLuxembourgerMacedonianMalaysianMalteseMarshalleseMenomineeMexicanMexican American IndianMongolianMoroccanNative HawaiianNavajoNepaleseNew ZealanderNicaraguanNigerianNorthern EuropeanNorwegianOkinawanOsageOttawaPaiutePakistaniPalestinianPanamanianParaguayanPennsylvania GermanPeruvianPimaPolishPortuguesePotawatomiPuebloPuerto RicanPuget Sound SalishRomanianRussianSalvadoranSamoanScandinavianScotch-IrishScottishSeminoleSenegaleseSerbianShoshoneSierra LeoneanSiouxSlavicSlovakSloveneSomaliSouth AfricanSouth AmericanSouth American IndianSoviet UnionSpaniardSpanishSpanish AmericanSpanish American IndianSri LankanSubsaharan AfricanSudaneseSwedishSwissSyrianTaiwaneseThaiTlingit-HaidaTohono O'OdhamTonganTrinidadian and TobagonianTsimshianTurkishU.S. Virgin IslanderUgandanUkrainianUruguayanUteVenezuelanVietnameseWelshWest IndianYakamaYaquiYugoslavianYumanYup'ikZimbabwean
Immigration
NonimmigrantsImmigrantsAfghanistanAfricaAlbaniaArgentinaArmeniaAsiaAustraliaAustriaBahamasBangladeshBarbadosBelarusBelgiumBelizeBoliviaBosnia and HerzegovinaBrazilBulgariaBurma/MyanmarCabo VerdeCambodiaCameroonCanadaCaribbeanCentral AmericaChileChinaColombiaCongoCosta RicaCroatiaCubaCzechoslovakiaDenmarkDominicaDominican RepublicEastern AfricaEastern AsiaEastern EuropeEcuadorEgyptEl SalvadorEnglandEritreaEthiopiaEuropeFijiFranceGermanyGhanaGreeceGrenadaGuatemalaGuyanaHaitiHondurasHong KongHungaryIndiaIndonesiaIranIraqIrelandIsraelItalyJamaicaJapanJordanKazakhstanKenyaKoreaKuwaitLaosLatin AmericaLatviaLebanonLiberiaLithuaniaMalaysiaMexicoMicronesiaMiddle AfricaMoldovaMoroccoNepalNetherlandsNicaraguaNigeriaNorth AmericaNorth MacedoniaNorthern AfricaNorthern EuropeNorwayOceaniaPakistanPanamaPeruPhilippinesPolandPortugalRomaniaRussiaSaudi ArabiaScotlandSenegalSerbiaSierra LeoneSingaporeSomaliaSouth AfricaSouth AmericaSouth Central AsiaSouth Eastern AsiaSouthern EuropeSpainSri LankaSt. Vincent and the GrenadinesSudanSwedenSwitzerlandSyriaTaiwanThailandTrinidad and TobagoTurkeyUgandaUkraineUruguayUzbekistanVenezuelaVietnamWest IndiesWestern AfricaWestern AsiaWestern EuropeYemenZaireZimbabweAzores
Median Male Earnings
Income
Poverty
Unemployment
Labor Participation
Family Structure
Vehicle Availability
Education Level
Disability

Median Male Earnings Comparison

Alsatians

Immigrants from Iraq

Good
Poor
$55,380
MEDIAN MALE EARNINGS
70.5/ 100
METRIC RATING
159th/ 347
METRIC RANK
$52,681
MEDIAN MALE EARNINGS
14.5/ 100
METRIC RATING
206th/ 347
METRIC RANK

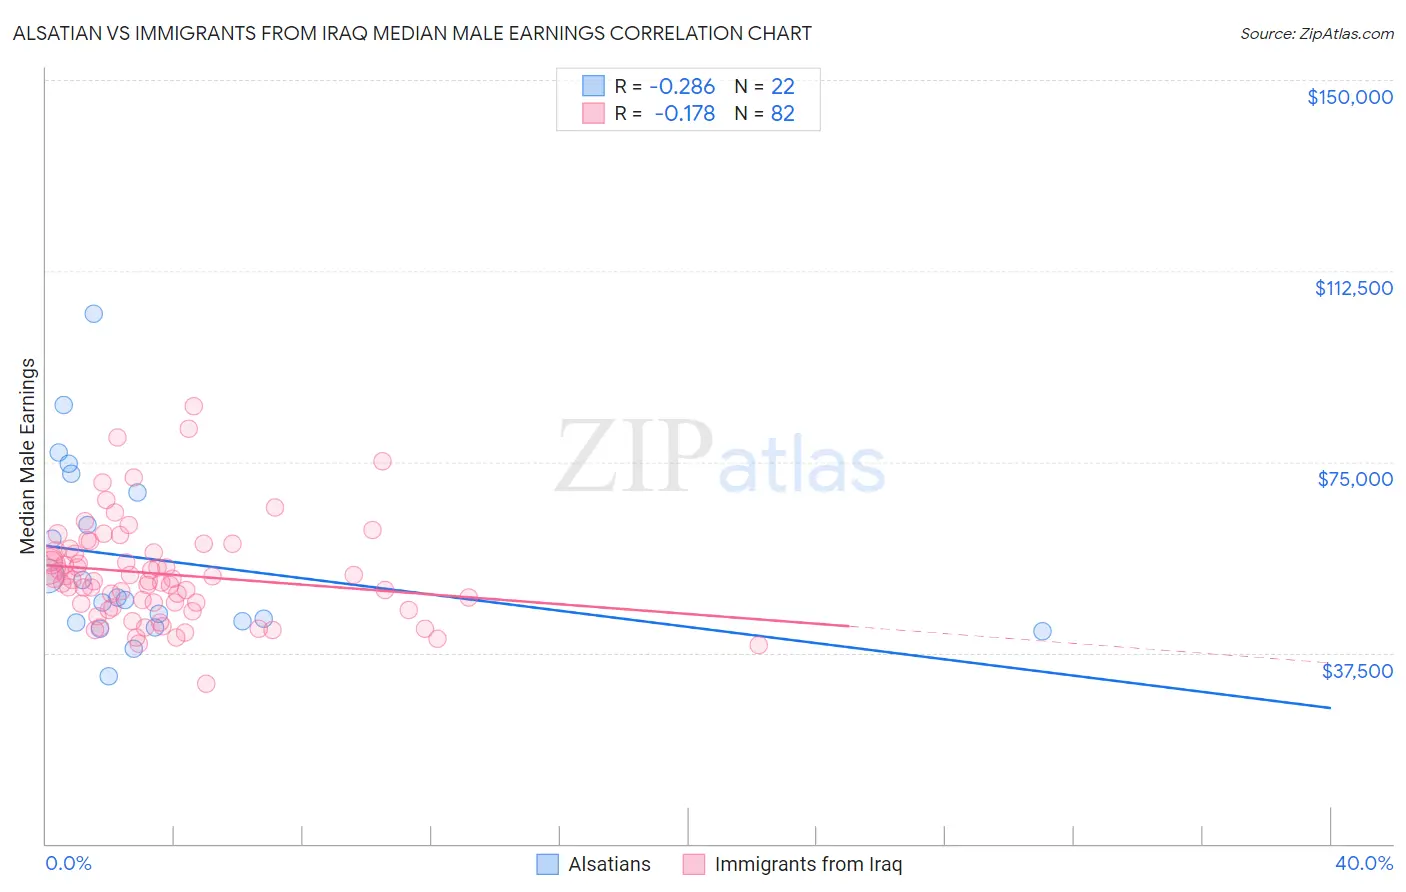
Alsatian vs Immigrants from Iraq Median Male Earnings Correlation Chart

The statistical analysis conducted on geographies consisting of 82,669,141 people shows a weak negative correlation between the proportion of Alsatians and median male earnings in the United States with a correlation coefficient (R) of -0.286 and weighted average of $55,380. Similarly, the statistical analysis conducted on geographies consisting of 194,755,120 people shows a poor negative correlation between the proportion of Immigrants from Iraq and median male earnings in the United States with a correlation coefficient (R) of -0.178 and weighted average of $52,681, a difference of 5.1%.
Alsatian vs Immigrants from Iraq Median Male Earnings

Median Male Earnings Correlation Summary

MeasurementAlsatianImmigrants from Iraq
Minimum$33,005$31,325
Maximum$104,004$85,833
Range$70,999$54,508
Mean$55,815$52,958
Median$48,104$51,715
Interquartile 25% (IQ1)$43,478$46,434
Interquartile 75% (IQ3)$69,063$57,443
Interquartile Range (IQR)$25,585$11,008
Standard Deviation (Sample)$17,889$9,945
Standard Deviation (Population)$17,478$9,884

Similar Demographics by Median Male Earnings

Demographics Similar to Alsatians by Median Male Earnings

In terms of median male earnings, the demographic groups most similar to Alsatians are Czechoslovakian ($55,382, a difference of 0.0%), Basque ($55,370, a difference of 0.020%), Belgian ($55,361, a difference of 0.030%), French ($55,350, a difference of 0.050%), and Icelander ($55,415, a difference of 0.060%).
DemographicsRating | RankMedian Male Earnings
Peruvians
75.8
/100
|
#152
Good
$55,659
Immigrants | Nepal
75.0
/100
|
#153
Good
$55,615
Taiwanese
73.9
/100
|
#154
Good
$55,556
Scandinavians
73.4
/100
|
#155
Good
$55,527
Immigrants | Ethiopia
71.6
/100
|
#156
Good
$55,434
Icelanders
71.2
/100
|
#157
Good
$55,415
Czechoslovakians
70.5
/100
|
#158
Good
$55,382
Alsatians
70.5
/100
|
#159
Good
$55,380
Basques
70.3
/100
|
#160
Good
$55,370
Belgians
70.1
/100
|
#161
Good
$55,361
French
69.9
/100
|
#162
Good
$55,350
Ugandans
68.6
/100
|
#163
Good
$55,290
Immigrants | South Eastern Asia
67.6
/100
|
#164
Good
$55,241
Immigrants | Portugal
66.3
/100
|
#165
Good
$55,182
Germans
61.6
/100
|
#166
Good
$54,974

Demographics Similar to Immigrants from Iraq by Median Male Earnings

In terms of median male earnings, the demographic groups most similar to Immigrants from Iraq are Immigrants from Colombia ($52,725, a difference of 0.080%), Ghanaian ($52,810, a difference of 0.24%), Panamanian ($52,835, a difference of 0.29%), Vietnamese ($52,525, a difference of 0.30%), and Venezuelan ($52,510, a difference of 0.33%).
DemographicsRating | RankMedian Male Earnings
Tongans
22.3
/100
|
#199
Fair
$53,218
Immigrants | Thailand
17.5
/100
|
#200
Poor
$52,908
Immigrants | Bosnia and Herzegovina
16.9
/100
|
#201
Poor
$52,869
Immigrants | Uruguay
16.8
/100
|
#202
Poor
$52,860
Panamanians
16.5
/100
|
#203
Poor
$52,835
Ghanaians
16.1
/100
|
#204
Poor
$52,810
Immigrants | Colombia
15.0
/100
|
#205
Poor
$52,725
Immigrants | Iraq
14.5
/100
|
#206
Poor
$52,681
Vietnamese
12.7
/100
|
#207
Poor
$52,525
Venezuelans
12.5
/100
|
#208
Poor
$52,510
Bermudans
12.1
/100
|
#209
Poor
$52,465
Delaware
11.5
/100
|
#210
Poor
$52,412
Tlingit-Haida
11.5
/100
|
#211
Poor
$52,409
Cajuns
10.7
/100
|
#212
Poor
$52,325
Native Hawaiians
10.5
/100
|
#213
Poor
$52,306