Immigrants from Belize vs Bulgarian Median Female Earnings
COMPARE
Immigrants from Belize
Bulgarian
Median Female Earnings
Median Female Earnings Comparison
Immigrants from Belize
Bulgarians
$37,056
MEDIAN FEMALE EARNINGS
0.4/ 100
METRIC RATING
265th/ 347
METRIC RANK
$43,638
MEDIAN FEMALE EARNINGS
100.0/ 100
METRIC RATING
43rd/ 347
METRIC RANK
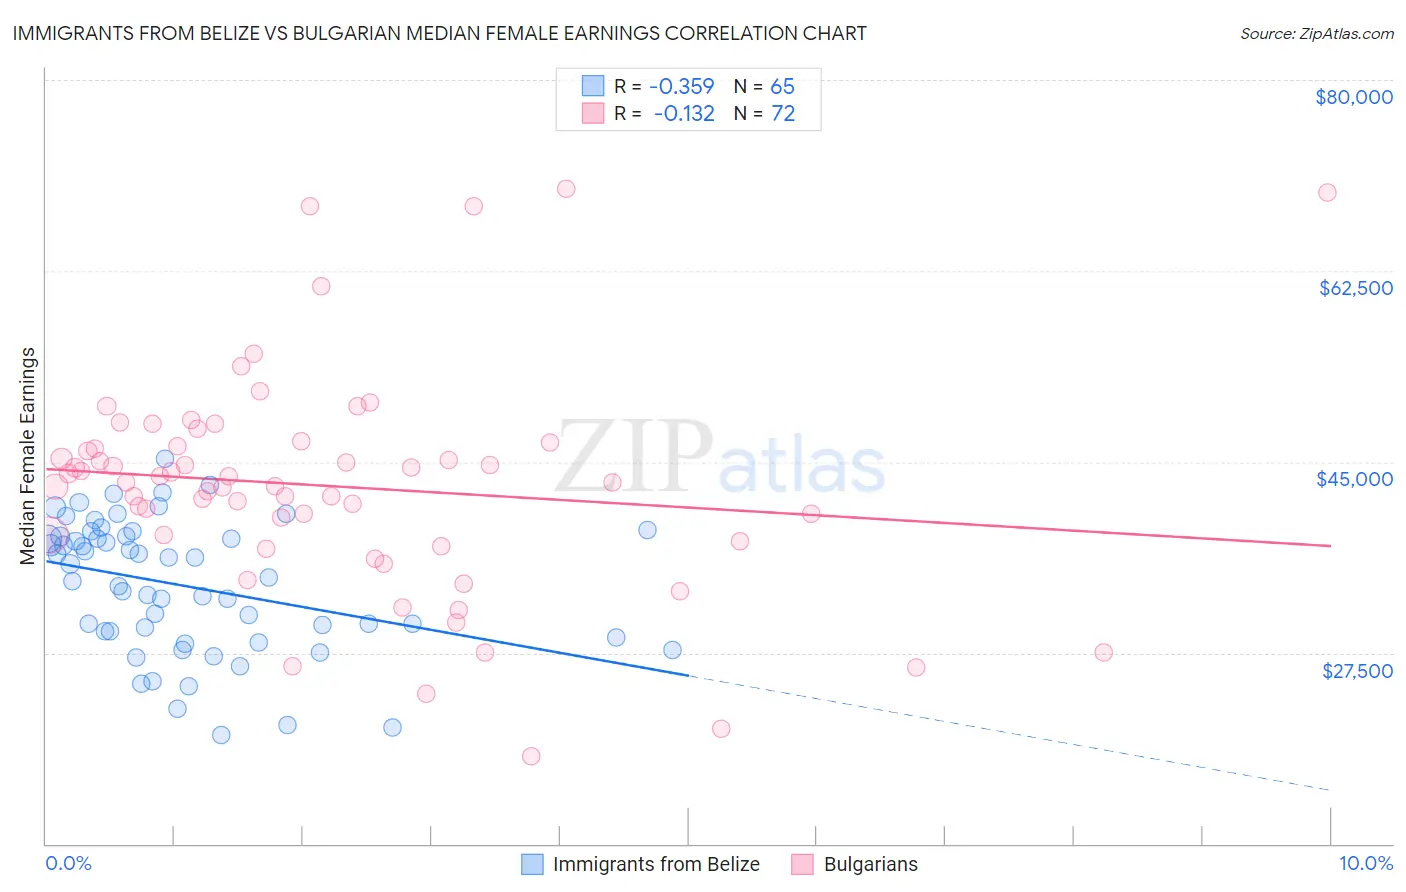
Immigrants from Belize vs Bulgarian Median Female Earnings Correlation Chart
The statistical analysis conducted on geographies consisting of 130,285,587 people shows a mild negative correlation between the proportion of Immigrants from Belize and median female earnings in the United States with a correlation coefficient (R) of -0.359 and weighted average of $37,056. Similarly, the statistical analysis conducted on geographies consisting of 205,601,132 people shows a poor negative correlation between the proportion of Bulgarians and median female earnings in the United States with a correlation coefficient (R) of -0.132 and weighted average of $43,638, a difference of 17.8%.
Median Female Earnings Correlation Summary
| Measurement | Immigrants from Belize | Bulgarian |
| Minimum | $19,964 | $18,066 |
| Maximum | $45,241 | $70,060 |
| Range | $25,277 | $51,994 |
| Mean | $33,651 | $42,770 |
| Median | $34,358 | $43,122 |
| Interquartile 25% (IQ1) | $29,185 | $37,998 |
| Interquartile 75% (IQ3) | $38,173 | $46,606 |
| Interquartile Range (IQR) | $8,989 | $8,608 |
| Standard Deviation (Sample) | $6,058 | $10,148 |
| Standard Deviation (Population) | $6,012 | $10,078 |
Similar Demographics by Median Female Earnings
Demographics Similar to Immigrants from Belize by Median Female Earnings
In terms of median female earnings, the demographic groups most similar to Immigrants from Belize are Dominican ($37,046, a difference of 0.030%), Salvadoran ($37,083, a difference of 0.070%), Nonimmigrants ($37,024, a difference of 0.090%), Cree ($37,018, a difference of 0.10%), and German Russian ($37,105, a difference of 0.13%).
| Demographics | Rating | Rank | Median Female Earnings |
| Belizeans | 0.9 /100 | #258 | Tragic $37,429 |
| Scotch-Irish | 0.8 /100 | #259 | Tragic $37,383 |
| Dutch | 0.7 /100 | #260 | Tragic $37,339 |
| Malaysians | 0.7 /100 | #261 | Tragic $37,298 |
| Venezuelans | 0.7 /100 | #262 | Tragic $37,282 |
| German Russians | 0.5 /100 | #263 | Tragic $37,105 |
| Salvadorans | 0.4 /100 | #264 | Tragic $37,083 |
| Immigrants | Belize | 0.4 /100 | #265 | Tragic $37,056 |
| Dominicans | 0.4 /100 | #266 | Tragic $37,046 |
| Immigrants | Nonimmigrants | 0.4 /100 | #267 | Tragic $37,024 |
| Cree | 0.4 /100 | #268 | Tragic $37,018 |
| Immigrants | Venezuela | 0.4 /100 | #269 | Tragic $37,003 |
| French American Indians | 0.3 /100 | #270 | Tragic $36,920 |
| Nicaraguans | 0.3 /100 | #271 | Tragic $36,904 |
| Immigrants | Dominican Republic | 0.3 /100 | #272 | Tragic $36,857 |
Demographics Similar to Bulgarians by Median Female Earnings
In terms of median female earnings, the demographic groups most similar to Bulgarians are Bhutanese ($43,648, a difference of 0.020%), Immigrants from Denmark ($43,646, a difference of 0.020%), Immigrants from Czechoslovakia ($43,571, a difference of 0.15%), Immigrants from Europe ($43,523, a difference of 0.26%), and Immigrants from Bolivia ($43,467, a difference of 0.39%).
| Demographics | Rating | Rank | Median Female Earnings |
| Immigrants | Turkey | 100.0 /100 | #36 | Exceptional $44,066 |
| Immigrants | Switzerland | 100.0 /100 | #37 | Exceptional $43,996 |
| Latvians | 100.0 /100 | #38 | Exceptional $43,941 |
| Israelis | 100.0 /100 | #39 | Exceptional $43,852 |
| Immigrants | Malaysia | 100.0 /100 | #40 | Exceptional $43,835 |
| Bhutanese | 100.0 /100 | #41 | Exceptional $43,648 |
| Immigrants | Denmark | 100.0 /100 | #42 | Exceptional $43,646 |
| Bulgarians | 100.0 /100 | #43 | Exceptional $43,638 |
| Immigrants | Czechoslovakia | 100.0 /100 | #44 | Exceptional $43,571 |
| Immigrants | Europe | 100.0 /100 | #45 | Exceptional $43,523 |
| Immigrants | Bolivia | 100.0 /100 | #46 | Exceptional $43,467 |
| Bolivians | 100.0 /100 | #47 | Exceptional $43,445 |
| Immigrants | Indonesia | 100.0 /100 | #48 | Exceptional $43,412 |
| Immigrants | Serbia | 100.0 /100 | #49 | Exceptional $43,385 |
| Immigrants | Uzbekistan | 100.0 /100 | #50 | Exceptional $43,363 |