Immigrants from Barbados vs Bulgarian Median Female Earnings
COMPARE
Immigrants from Barbados
Bulgarian
Median Female Earnings
Median Female Earnings Comparison
Immigrants from Barbados
Bulgarians
$41,685
MEDIAN FEMALE EARNINGS
98.4/ 100
METRIC RATING
99th/ 347
METRIC RANK
$43,638
MEDIAN FEMALE EARNINGS
100.0/ 100
METRIC RATING
43rd/ 347
METRIC RANK
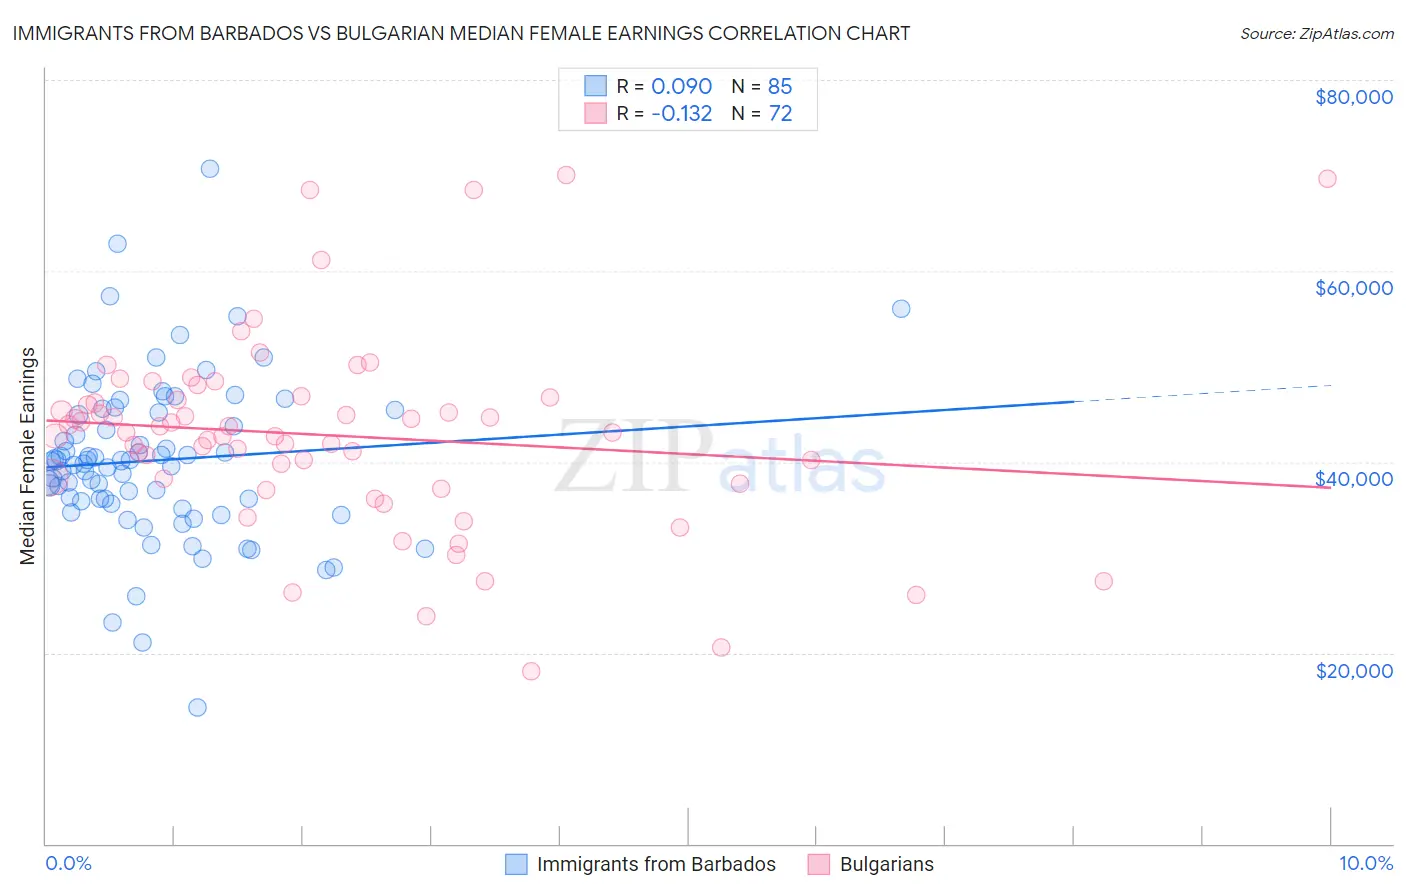
Immigrants from Barbados vs Bulgarian Median Female Earnings Correlation Chart
The statistical analysis conducted on geographies consisting of 112,771,231 people shows a slight positive correlation between the proportion of Immigrants from Barbados and median female earnings in the United States with a correlation coefficient (R) of 0.090 and weighted average of $41,685. Similarly, the statistical analysis conducted on geographies consisting of 205,601,132 people shows a poor negative correlation between the proportion of Bulgarians and median female earnings in the United States with a correlation coefficient (R) of -0.132 and weighted average of $43,638, a difference of 4.7%.
Median Female Earnings Correlation Summary
| Measurement | Immigrants from Barbados | Bulgarian |
| Minimum | $14,324 | $18,066 |
| Maximum | $70,712 | $70,060 |
| Range | $56,388 | $51,994 |
| Mean | $40,171 | $42,770 |
| Median | $40,011 | $43,122 |
| Interquartile 25% (IQ1) | $35,731 | $37,998 |
| Interquartile 75% (IQ3) | $45,302 | $46,606 |
| Interquartile Range (IQR) | $9,570 | $8,608 |
| Standard Deviation (Sample) | $8,566 | $10,148 |
| Standard Deviation (Population) | $8,515 | $10,078 |
Similar Demographics by Median Female Earnings
Demographics Similar to Immigrants from Barbados by Median Female Earnings
In terms of median female earnings, the demographic groups most similar to Immigrants from Barbados are Romanian ($41,663, a difference of 0.050%), Immigrants from Fiji ($41,656, a difference of 0.070%), Immigrants from Poland ($41,630, a difference of 0.13%), Immigrants from Scotland ($41,771, a difference of 0.21%), and Immigrants from Argentina ($41,554, a difference of 0.31%).
| Demographics | Rating | Rank | Median Female Earnings |
| Argentineans | 99.1 /100 | #92 | Exceptional $41,952 |
| Immigrants | Grenada | 99.0 /100 | #93 | Exceptional $41,932 |
| Moroccans | 98.9 /100 | #94 | Exceptional $41,872 |
| Immigrants | Netherlands | 98.9 /100 | #95 | Exceptional $41,870 |
| South Africans | 98.8 /100 | #96 | Exceptional $41,825 |
| Immigrants | Hungary | 98.8 /100 | #97 | Exceptional $41,820 |
| Immigrants | Scotland | 98.7 /100 | #98 | Exceptional $41,771 |
| Immigrants | Barbados | 98.4 /100 | #99 | Exceptional $41,685 |
| Romanians | 98.3 /100 | #100 | Exceptional $41,663 |
| Immigrants | Fiji | 98.3 /100 | #101 | Exceptional $41,656 |
| Immigrants | Poland | 98.2 /100 | #102 | Exceptional $41,630 |
| Immigrants | Argentina | 97.9 /100 | #103 | Exceptional $41,554 |
| Immigrants | Zimbabwe | 97.8 /100 | #104 | Exceptional $41,527 |
| Italians | 97.7 /100 | #105 | Exceptional $41,505 |
| Immigrants | Eritrea | 97.6 /100 | #106 | Exceptional $41,485 |
Demographics Similar to Bulgarians by Median Female Earnings
In terms of median female earnings, the demographic groups most similar to Bulgarians are Bhutanese ($43,648, a difference of 0.020%), Immigrants from Denmark ($43,646, a difference of 0.020%), Immigrants from Czechoslovakia ($43,571, a difference of 0.15%), Immigrants from Europe ($43,523, a difference of 0.26%), and Immigrants from Bolivia ($43,467, a difference of 0.39%).
| Demographics | Rating | Rank | Median Female Earnings |
| Immigrants | Turkey | 100.0 /100 | #36 | Exceptional $44,066 |
| Immigrants | Switzerland | 100.0 /100 | #37 | Exceptional $43,996 |
| Latvians | 100.0 /100 | #38 | Exceptional $43,941 |
| Israelis | 100.0 /100 | #39 | Exceptional $43,852 |
| Immigrants | Malaysia | 100.0 /100 | #40 | Exceptional $43,835 |
| Bhutanese | 100.0 /100 | #41 | Exceptional $43,648 |
| Immigrants | Denmark | 100.0 /100 | #42 | Exceptional $43,646 |
| Bulgarians | 100.0 /100 | #43 | Exceptional $43,638 |
| Immigrants | Czechoslovakia | 100.0 /100 | #44 | Exceptional $43,571 |
| Immigrants | Europe | 100.0 /100 | #45 | Exceptional $43,523 |
| Immigrants | Bolivia | 100.0 /100 | #46 | Exceptional $43,467 |
| Bolivians | 100.0 /100 | #47 | Exceptional $43,445 |
| Immigrants | Indonesia | 100.0 /100 | #48 | Exceptional $43,412 |
| Immigrants | Serbia | 100.0 /100 | #49 | Exceptional $43,385 |
| Immigrants | Uzbekistan | 100.0 /100 | #50 | Exceptional $43,363 |