Immigrants from Congo vs Bulgarian Median Female Earnings
COMPARE
Immigrants from Congo
Bulgarian
Median Female Earnings
Median Female Earnings Comparison
Immigrants from Congo
Bulgarians
$34,317
MEDIAN FEMALE EARNINGS
0.0/ 100
METRIC RATING
324th/ 347
METRIC RANK
$43,638
MEDIAN FEMALE EARNINGS
100.0/ 100
METRIC RATING
43rd/ 347
METRIC RANK
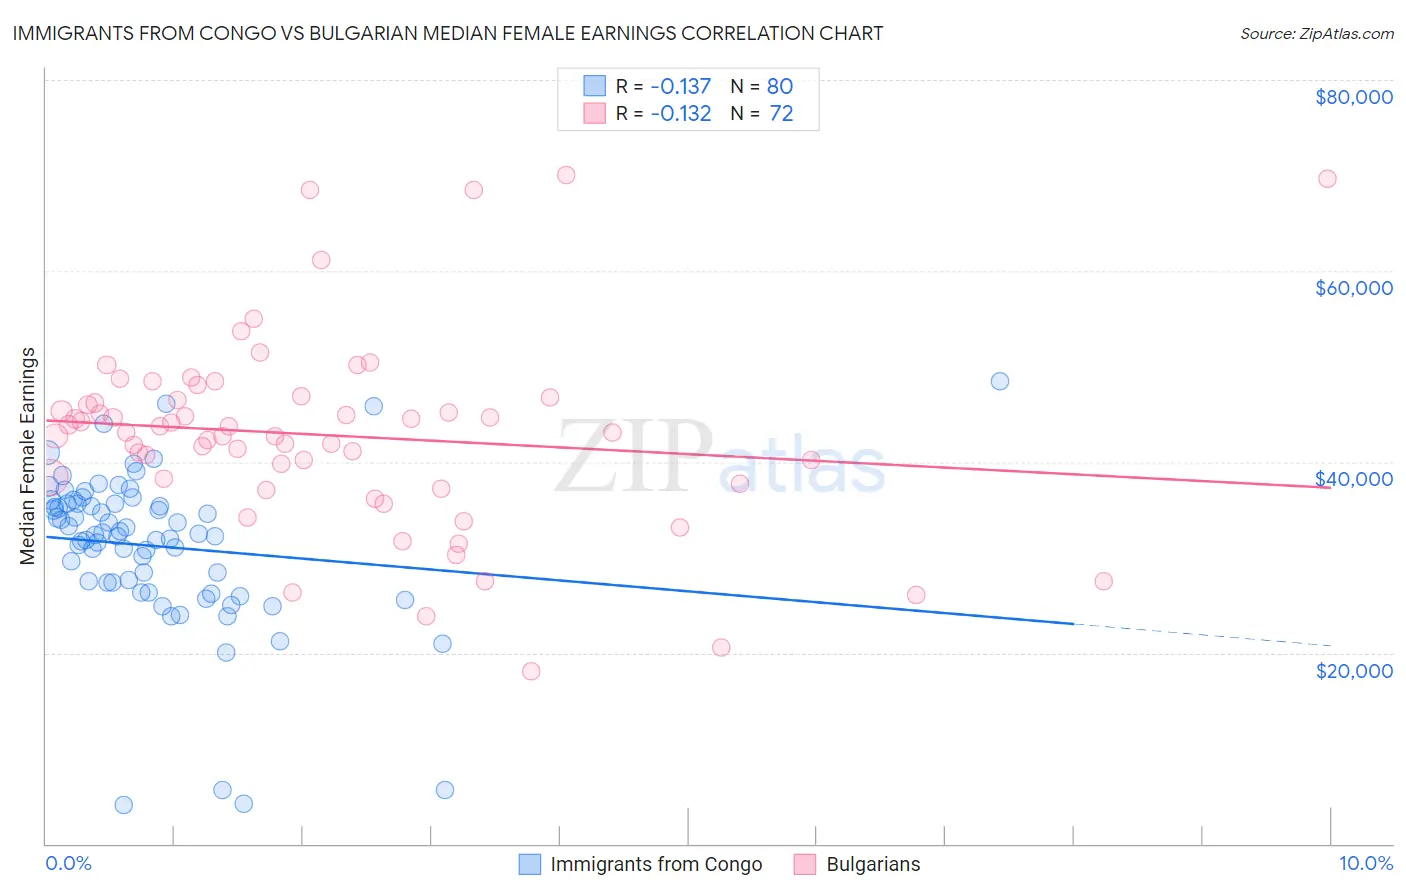
Immigrants from Congo vs Bulgarian Median Female Earnings Correlation Chart
The statistical analysis conducted on geographies consisting of 92,121,393 people shows a poor negative correlation between the proportion of Immigrants from Congo and median female earnings in the United States with a correlation coefficient (R) of -0.137 and weighted average of $34,317. Similarly, the statistical analysis conducted on geographies consisting of 205,601,132 people shows a poor negative correlation between the proportion of Bulgarians and median female earnings in the United States with a correlation coefficient (R) of -0.132 and weighted average of $43,638, a difference of 27.2%.
Median Female Earnings Correlation Summary
| Measurement | Immigrants from Congo | Bulgarian |
| Minimum | $4,095 | $18,066 |
| Maximum | $48,487 | $70,060 |
| Range | $44,392 | $51,994 |
| Mean | $31,171 | $42,770 |
| Median | $32,459 | $43,122 |
| Interquartile 25% (IQ1) | $27,374 | $37,998 |
| Interquartile 75% (IQ3) | $35,656 | $46,606 |
| Interquartile Range (IQR) | $8,283 | $8,608 |
| Standard Deviation (Sample) | $8,300 | $10,148 |
| Standard Deviation (Population) | $8,248 | $10,078 |
Similar Demographics by Median Female Earnings
Demographics Similar to Immigrants from Congo by Median Female Earnings
In terms of median female earnings, the demographic groups most similar to Immigrants from Congo are Seminole ($34,385, a difference of 0.20%), Chickasaw ($34,414, a difference of 0.28%), Hispanic or Latino ($34,421, a difference of 0.31%), Dutch West Indian ($34,106, a difference of 0.62%), and Kiowa ($34,074, a difference of 0.71%).
| Demographics | Rating | Rank | Median Female Earnings |
| Potawatomi | 0.0 /100 | #317 | Tragic $34,739 |
| Immigrants | Yemen | 0.0 /100 | #318 | Tragic $34,693 |
| Shoshone | 0.0 /100 | #319 | Tragic $34,677 |
| Immigrants | Honduras | 0.0 /100 | #320 | Tragic $34,647 |
| Hispanics or Latinos | 0.0 /100 | #321 | Tragic $34,421 |
| Chickasaw | 0.0 /100 | #322 | Tragic $34,414 |
| Seminole | 0.0 /100 | #323 | Tragic $34,385 |
| Immigrants | Congo | 0.0 /100 | #324 | Tragic $34,317 |
| Dutch West Indians | 0.0 /100 | #325 | Tragic $34,106 |
| Kiowa | 0.0 /100 | #326 | Tragic $34,074 |
| Cajuns | 0.0 /100 | #327 | Tragic $34,034 |
| Immigrants | Central America | 0.0 /100 | #328 | Tragic $33,953 |
| Hopi | 0.0 /100 | #329 | Tragic $33,932 |
| Menominee | 0.0 /100 | #330 | Tragic $33,894 |
| Natives/Alaskans | 0.0 /100 | #331 | Tragic $33,806 |
Demographics Similar to Bulgarians by Median Female Earnings
In terms of median female earnings, the demographic groups most similar to Bulgarians are Bhutanese ($43,648, a difference of 0.020%), Immigrants from Denmark ($43,646, a difference of 0.020%), Immigrants from Czechoslovakia ($43,571, a difference of 0.15%), Immigrants from Europe ($43,523, a difference of 0.26%), and Immigrants from Bolivia ($43,467, a difference of 0.39%).
| Demographics | Rating | Rank | Median Female Earnings |
| Immigrants | Turkey | 100.0 /100 | #36 | Exceptional $44,066 |
| Immigrants | Switzerland | 100.0 /100 | #37 | Exceptional $43,996 |
| Latvians | 100.0 /100 | #38 | Exceptional $43,941 |
| Israelis | 100.0 /100 | #39 | Exceptional $43,852 |
| Immigrants | Malaysia | 100.0 /100 | #40 | Exceptional $43,835 |
| Bhutanese | 100.0 /100 | #41 | Exceptional $43,648 |
| Immigrants | Denmark | 100.0 /100 | #42 | Exceptional $43,646 |
| Bulgarians | 100.0 /100 | #43 | Exceptional $43,638 |
| Immigrants | Czechoslovakia | 100.0 /100 | #44 | Exceptional $43,571 |
| Immigrants | Europe | 100.0 /100 | #45 | Exceptional $43,523 |
| Immigrants | Bolivia | 100.0 /100 | #46 | Exceptional $43,467 |
| Bolivians | 100.0 /100 | #47 | Exceptional $43,445 |
| Immigrants | Indonesia | 100.0 /100 | #48 | Exceptional $43,412 |
| Immigrants | Serbia | 100.0 /100 | #49 | Exceptional $43,385 |
| Immigrants | Uzbekistan | 100.0 /100 | #50 | Exceptional $43,363 |