Immigrants from Belgium vs Immigrants from Kenya Median Earnings
COMPARE
Immigrants from Belgium
Immigrants from Kenya
Median Earnings
Median Earnings Comparison
Immigrants from Belgium
Immigrants from Kenya
$54,679
MEDIAN EARNINGS
100.0/ 100
METRIC RATING
19th/ 347
METRIC RANK
$46,214
MEDIAN EARNINGS
42.4/ 100
METRIC RATING
184th/ 347
METRIC RANK
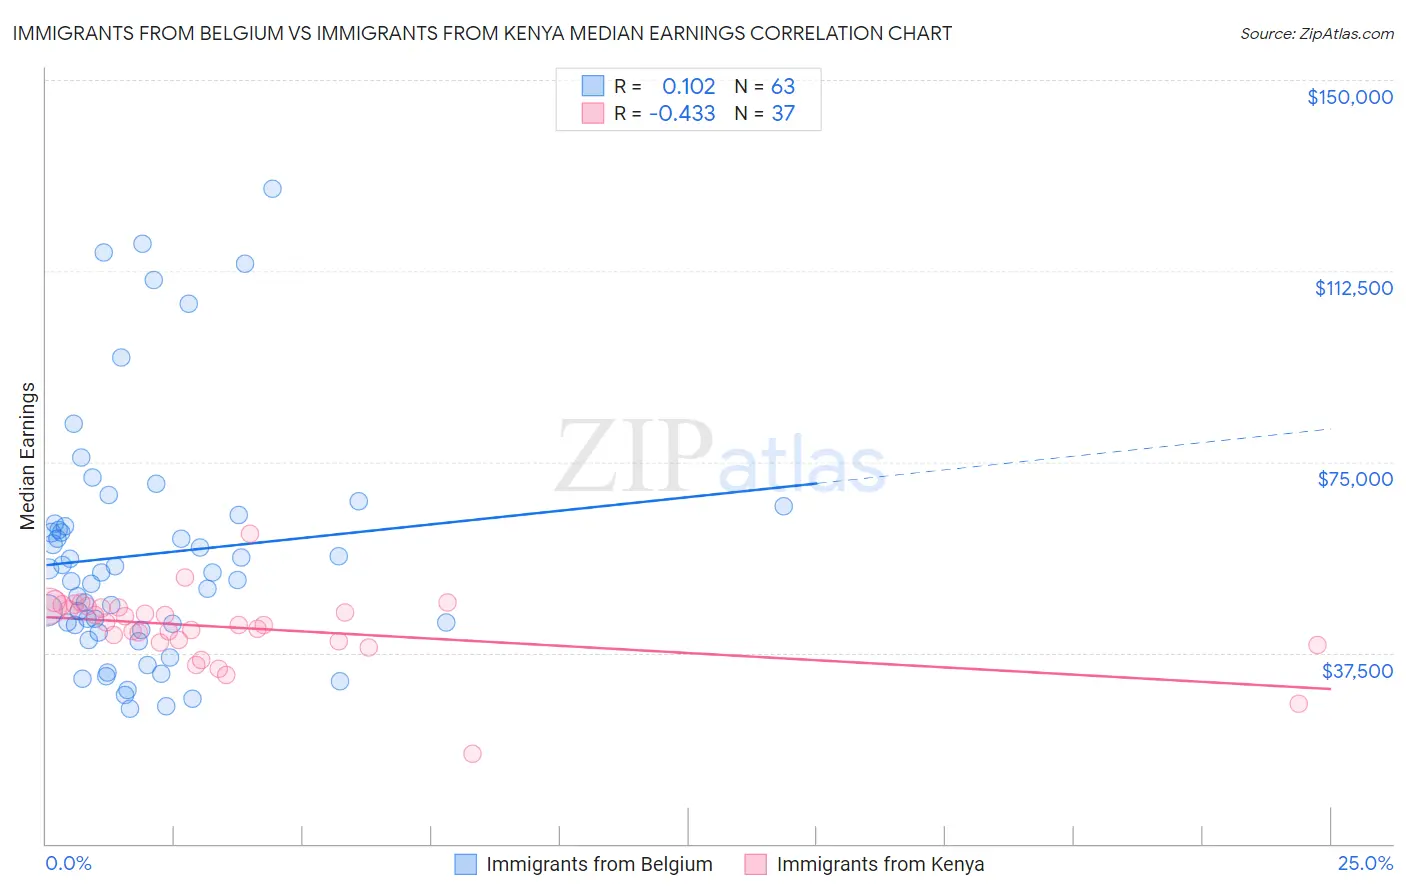
Immigrants from Belgium vs Immigrants from Kenya Median Earnings Correlation Chart
The statistical analysis conducted on geographies consisting of 146,713,420 people shows a poor positive correlation between the proportion of Immigrants from Belgium and median earnings in the United States with a correlation coefficient (R) of 0.102 and weighted average of $54,679. Similarly, the statistical analysis conducted on geographies consisting of 218,063,953 people shows a moderate negative correlation between the proportion of Immigrants from Kenya and median earnings in the United States with a correlation coefficient (R) of -0.433 and weighted average of $46,214, a difference of 18.3%.
Median Earnings Correlation Summary
| Measurement | Immigrants from Belgium | Immigrants from Kenya |
| Minimum | $26,625 | $17,794 |
| Maximum | $128,750 | $60,938 |
| Range | $102,125 | $43,144 |
| Mean | $56,854 | $42,338 |
| Median | $53,265 | $42,995 |
| Interquartile 25% (IQ1) | $41,924 | $39,646 |
| Interquartile 75% (IQ3) | $62,836 | $46,440 |
| Interquartile Range (IQR) | $20,912 | $6,794 |
| Standard Deviation (Sample) | $23,786 | $7,069 |
| Standard Deviation (Population) | $23,597 | $6,973 |
Similar Demographics by Median Earnings
Demographics Similar to Immigrants from Belgium by Median Earnings
In terms of median earnings, the demographic groups most similar to Immigrants from Belgium are Cypriot ($54,589, a difference of 0.16%), Burmese ($54,559, a difference of 0.22%), Immigrants from Korea ($54,530, a difference of 0.27%), Immigrants from Sweden ($54,478, a difference of 0.37%), and Immigrants from Japan ($54,938, a difference of 0.47%).
| Demographics | Rating | Rank | Median Earnings |
| Immigrants | Ireland | 100.0 /100 | #12 | Exceptional $56,854 |
| Immigrants | China | 100.0 /100 | #13 | Exceptional $56,638 |
| Immigrants | Australia | 100.0 /100 | #14 | Exceptional $56,305 |
| Indians (Asian) | 100.0 /100 | #15 | Exceptional $56,253 |
| Immigrants | Eastern Asia | 100.0 /100 | #16 | Exceptional $56,183 |
| Eastern Europeans | 100.0 /100 | #17 | Exceptional $55,084 |
| Immigrants | Japan | 100.0 /100 | #18 | Exceptional $54,938 |
| Immigrants | Belgium | 100.0 /100 | #19 | Exceptional $54,679 |
| Cypriots | 100.0 /100 | #20 | Exceptional $54,589 |
| Burmese | 100.0 /100 | #21 | Exceptional $54,559 |
| Immigrants | Korea | 100.0 /100 | #22 | Exceptional $54,530 |
| Immigrants | Sweden | 100.0 /100 | #23 | Exceptional $54,478 |
| Soviet Union | 100.0 /100 | #24 | Exceptional $54,290 |
| Turks | 100.0 /100 | #25 | Exceptional $53,919 |
| Immigrants | Northern Europe | 100.0 /100 | #26 | Exceptional $53,872 |
Demographics Similar to Immigrants from Kenya by Median Earnings
In terms of median earnings, the demographic groups most similar to Immigrants from Kenya are Uruguayan ($46,190, a difference of 0.050%), Vietnamese ($46,172, a difference of 0.090%), Iraqi ($46,140, a difference of 0.16%), French ($46,296, a difference of 0.18%), and Swiss ($46,315, a difference of 0.22%).
| Demographics | Rating | Rank | Median Earnings |
| Belgians | 48.0 /100 | #177 | Average $46,375 |
| Colombians | 47.1 /100 | #178 | Average $46,349 |
| English | 46.5 /100 | #179 | Average $46,334 |
| Puget Sound Salish | 46.5 /100 | #180 | Average $46,333 |
| Immigrants | Cameroon | 46.4 /100 | #181 | Average $46,329 |
| Swiss | 45.9 /100 | #182 | Average $46,315 |
| French | 45.2 /100 | #183 | Average $46,296 |
| Immigrants | Kenya | 42.4 /100 | #184 | Average $46,214 |
| Uruguayans | 41.6 /100 | #185 | Average $46,190 |
| Vietnamese | 40.9 /100 | #186 | Average $46,172 |
| Iraqis | 39.9 /100 | #187 | Fair $46,140 |
| Immigrants | Armenia | 38.3 /100 | #188 | Fair $46,094 |
| Spaniards | 37.2 /100 | #189 | Fair $46,059 |
| French Canadians | 36.1 /100 | #190 | Fair $46,026 |
| Finns | 33.4 /100 | #191 | Fair $45,940 |