Immigrants from Belgium vs Choctaw Median Earnings
COMPARE
Immigrants from Belgium
Choctaw
Median Earnings
Median Earnings Comparison
Immigrants from Belgium
Choctaw
$54,679
MEDIAN EARNINGS
100.0/ 100
METRIC RATING
19th/ 347
METRIC RANK
$40,270
MEDIAN EARNINGS
0.0/ 100
METRIC RATING
313th/ 347
METRIC RANK
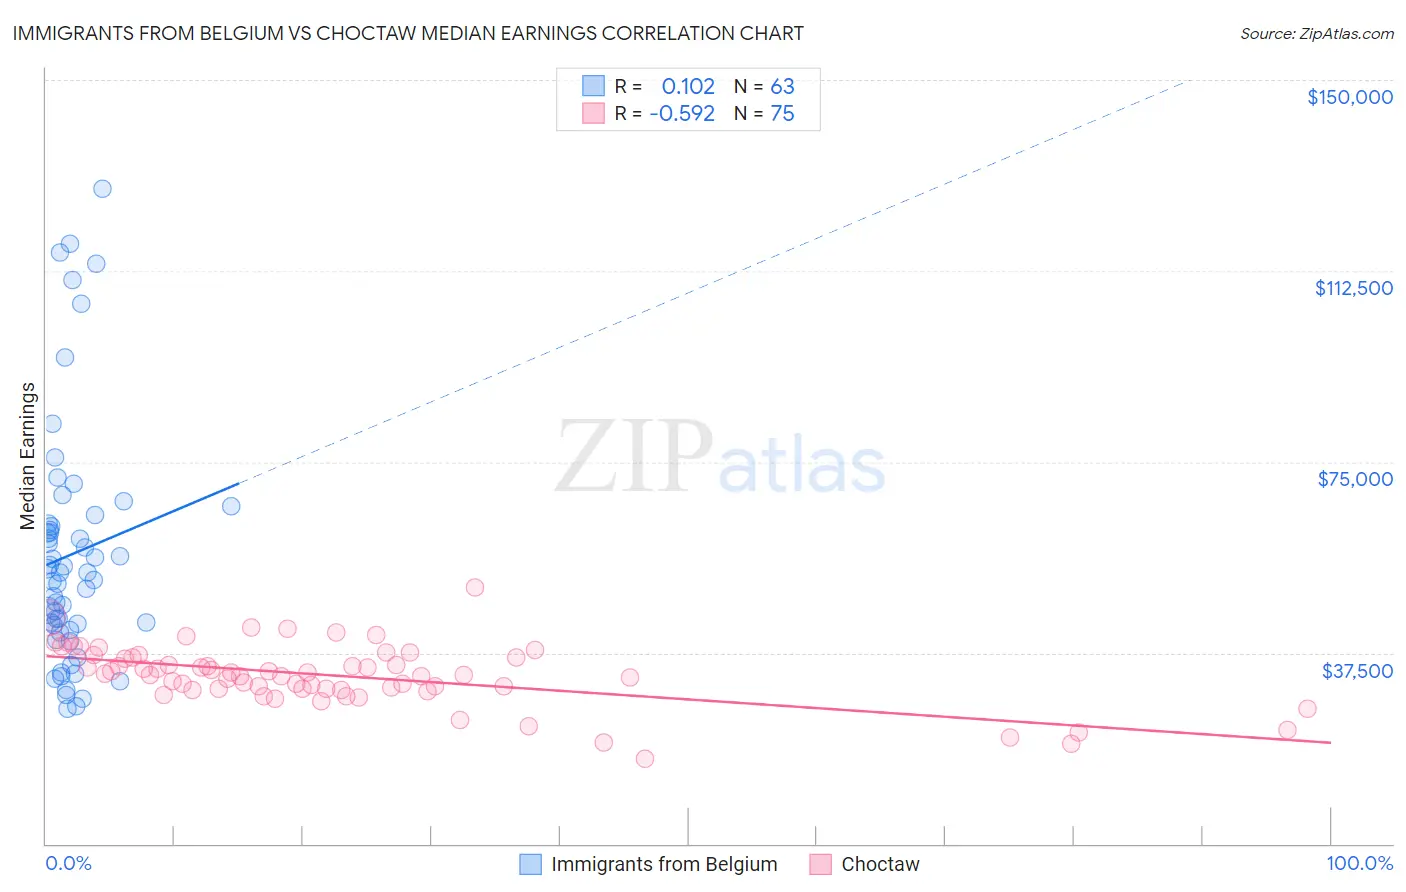
Immigrants from Belgium vs Choctaw Median Earnings Correlation Chart
The statistical analysis conducted on geographies consisting of 146,713,420 people shows a poor positive correlation between the proportion of Immigrants from Belgium and median earnings in the United States with a correlation coefficient (R) of 0.102 and weighted average of $54,679. Similarly, the statistical analysis conducted on geographies consisting of 269,709,236 people shows a substantial negative correlation between the proportion of Choctaw and median earnings in the United States with a correlation coefficient (R) of -0.592 and weighted average of $40,270, a difference of 35.8%.
Median Earnings Correlation Summary
| Measurement | Immigrants from Belgium | Choctaw |
| Minimum | $26,625 | $16,607 |
| Maximum | $128,750 | $50,240 |
| Range | $102,125 | $33,633 |
| Mean | $56,854 | $33,003 |
| Median | $53,265 | $33,256 |
| Interquartile 25% (IQ1) | $41,924 | $30,391 |
| Interquartile 75% (IQ3) | $62,836 | $36,563 |
| Interquartile Range (IQR) | $20,912 | $6,172 |
| Standard Deviation (Sample) | $23,786 | $5,920 |
| Standard Deviation (Population) | $23,597 | $5,880 |
Similar Demographics by Median Earnings
Demographics Similar to Immigrants from Belgium by Median Earnings
In terms of median earnings, the demographic groups most similar to Immigrants from Belgium are Cypriot ($54,589, a difference of 0.16%), Burmese ($54,559, a difference of 0.22%), Immigrants from Korea ($54,530, a difference of 0.27%), Immigrants from Sweden ($54,478, a difference of 0.37%), and Immigrants from Japan ($54,938, a difference of 0.47%).
| Demographics | Rating | Rank | Median Earnings |
| Immigrants | Ireland | 100.0 /100 | #12 | Exceptional $56,854 |
| Immigrants | China | 100.0 /100 | #13 | Exceptional $56,638 |
| Immigrants | Australia | 100.0 /100 | #14 | Exceptional $56,305 |
| Indians (Asian) | 100.0 /100 | #15 | Exceptional $56,253 |
| Immigrants | Eastern Asia | 100.0 /100 | #16 | Exceptional $56,183 |
| Eastern Europeans | 100.0 /100 | #17 | Exceptional $55,084 |
| Immigrants | Japan | 100.0 /100 | #18 | Exceptional $54,938 |
| Immigrants | Belgium | 100.0 /100 | #19 | Exceptional $54,679 |
| Cypriots | 100.0 /100 | #20 | Exceptional $54,589 |
| Burmese | 100.0 /100 | #21 | Exceptional $54,559 |
| Immigrants | Korea | 100.0 /100 | #22 | Exceptional $54,530 |
| Immigrants | Sweden | 100.0 /100 | #23 | Exceptional $54,478 |
| Soviet Union | 100.0 /100 | #24 | Exceptional $54,290 |
| Turks | 100.0 /100 | #25 | Exceptional $53,919 |
| Immigrants | Northern Europe | 100.0 /100 | #26 | Exceptional $53,872 |
Demographics Similar to Choctaw by Median Earnings
In terms of median earnings, the demographic groups most similar to Choctaw are Hispanic or Latino ($40,288, a difference of 0.040%), Chippewa ($40,287, a difference of 0.040%), Cheyenne ($40,233, a difference of 0.090%), Seminole ($40,233, a difference of 0.090%), and Immigrants from Honduras ($40,195, a difference of 0.19%).
| Demographics | Rating | Rank | Median Earnings |
| Yaqui | 0.0 /100 | #306 | Tragic $40,647 |
| Hondurans | 0.0 /100 | #307 | Tragic $40,638 |
| Cubans | 0.0 /100 | #308 | Tragic $40,619 |
| Immigrants | Haiti | 0.0 /100 | #309 | Tragic $40,550 |
| Apache | 0.0 /100 | #310 | Tragic $40,388 |
| Hispanics or Latinos | 0.0 /100 | #311 | Tragic $40,288 |
| Chippewa | 0.0 /100 | #312 | Tragic $40,287 |
| Choctaw | 0.0 /100 | #313 | Tragic $40,270 |
| Cheyenne | 0.0 /100 | #314 | Tragic $40,233 |
| Seminole | 0.0 /100 | #315 | Tragic $40,233 |
| Immigrants | Honduras | 0.0 /100 | #316 | Tragic $40,195 |
| Fijians | 0.0 /100 | #317 | Tragic $40,193 |
| Dutch West Indians | 0.0 /100 | #318 | Tragic $40,107 |
| Blacks/African Americans | 0.0 /100 | #319 | Tragic $40,085 |
| Immigrants | Bahamas | 0.0 /100 | #320 | Tragic $39,861 |