Immigrants from Belgium vs Sierra Leonean Median Earnings
COMPARE
Immigrants from Belgium
Sierra Leonean
Median Earnings
Median Earnings Comparison
Immigrants from Belgium
Sierra Leoneans
$54,679
MEDIAN EARNINGS
100.0/ 100
METRIC RATING
19th/ 347
METRIC RANK
$48,286
MEDIAN EARNINGS
93.1/ 100
METRIC RATING
127th/ 347
METRIC RANK
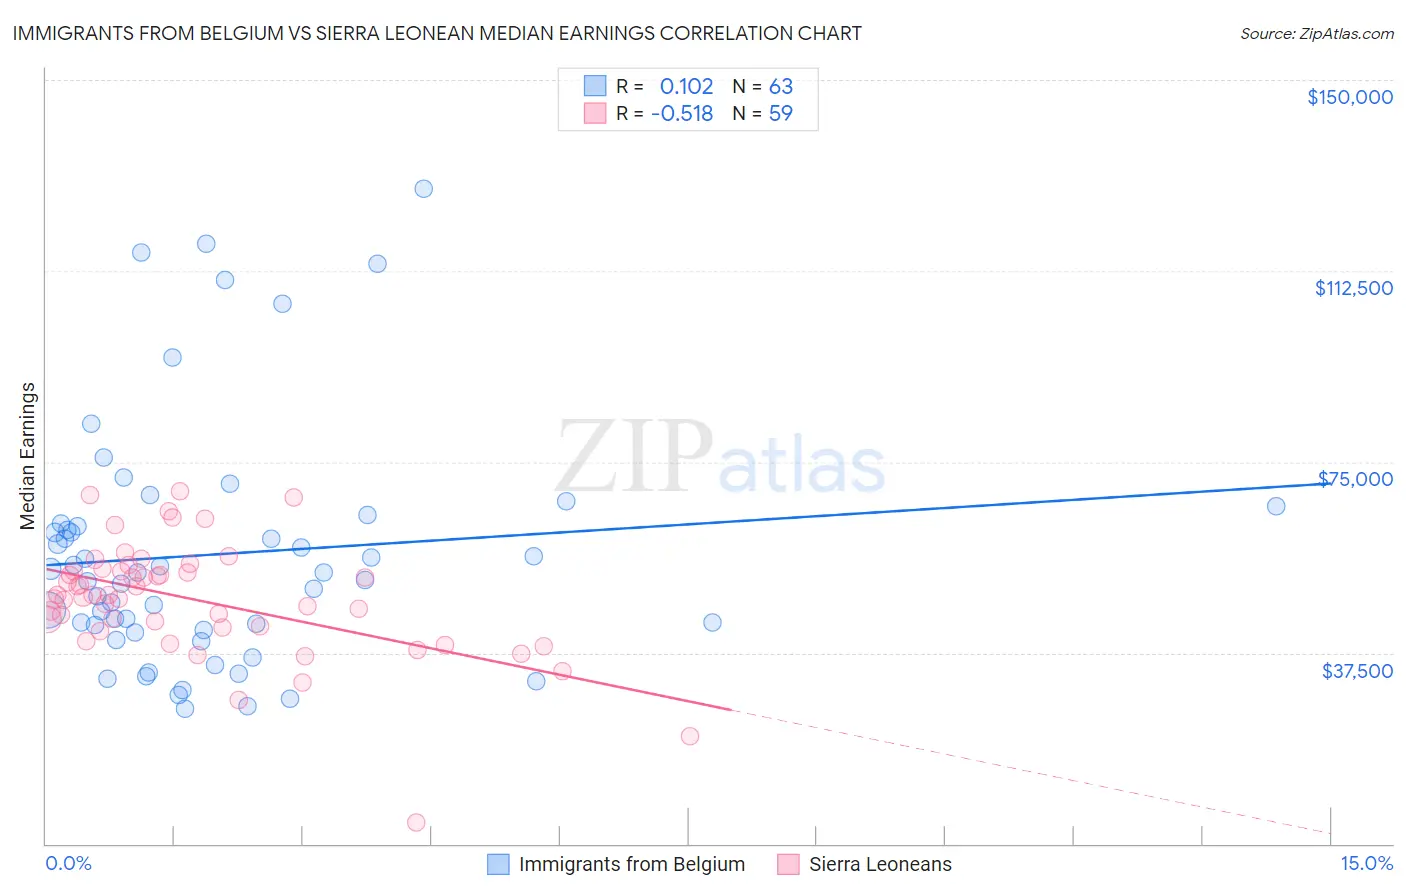
Immigrants from Belgium vs Sierra Leonean Median Earnings Correlation Chart
The statistical analysis conducted on geographies consisting of 146,713,420 people shows a poor positive correlation between the proportion of Immigrants from Belgium and median earnings in the United States with a correlation coefficient (R) of 0.102 and weighted average of $54,679. Similarly, the statistical analysis conducted on geographies consisting of 83,350,653 people shows a substantial negative correlation between the proportion of Sierra Leoneans and median earnings in the United States with a correlation coefficient (R) of -0.518 and weighted average of $48,286, a difference of 13.2%.
Median Earnings Correlation Summary
| Measurement | Immigrants from Belgium | Sierra Leonean |
| Minimum | $26,625 | $4,235 |
| Maximum | $128,750 | $69,241 |
| Range | $102,125 | $65,006 |
| Mean | $56,854 | $47,947 |
| Median | $53,265 | $48,865 |
| Interquartile 25% (IQ1) | $41,924 | $42,439 |
| Interquartile 75% (IQ3) | $62,836 | $53,466 |
| Interquartile Range (IQR) | $20,912 | $11,027 |
| Standard Deviation (Sample) | $23,786 | $11,282 |
| Standard Deviation (Population) | $23,597 | $11,186 |
Similar Demographics by Median Earnings
Demographics Similar to Immigrants from Belgium by Median Earnings
In terms of median earnings, the demographic groups most similar to Immigrants from Belgium are Cypriot ($54,589, a difference of 0.16%), Burmese ($54,559, a difference of 0.22%), Immigrants from Korea ($54,530, a difference of 0.27%), Immigrants from Sweden ($54,478, a difference of 0.37%), and Immigrants from Japan ($54,938, a difference of 0.47%).
| Demographics | Rating | Rank | Median Earnings |
| Immigrants | Ireland | 100.0 /100 | #12 | Exceptional $56,854 |
| Immigrants | China | 100.0 /100 | #13 | Exceptional $56,638 |
| Immigrants | Australia | 100.0 /100 | #14 | Exceptional $56,305 |
| Indians (Asian) | 100.0 /100 | #15 | Exceptional $56,253 |
| Immigrants | Eastern Asia | 100.0 /100 | #16 | Exceptional $56,183 |
| Eastern Europeans | 100.0 /100 | #17 | Exceptional $55,084 |
| Immigrants | Japan | 100.0 /100 | #18 | Exceptional $54,938 |
| Immigrants | Belgium | 100.0 /100 | #19 | Exceptional $54,679 |
| Cypriots | 100.0 /100 | #20 | Exceptional $54,589 |
| Burmese | 100.0 /100 | #21 | Exceptional $54,559 |
| Immigrants | Korea | 100.0 /100 | #22 | Exceptional $54,530 |
| Immigrants | Sweden | 100.0 /100 | #23 | Exceptional $54,478 |
| Soviet Union | 100.0 /100 | #24 | Exceptional $54,290 |
| Turks | 100.0 /100 | #25 | Exceptional $53,919 |
| Immigrants | Northern Europe | 100.0 /100 | #26 | Exceptional $53,872 |
Demographics Similar to Sierra Leoneans by Median Earnings
In terms of median earnings, the demographic groups most similar to Sierra Leoneans are Immigrants from Fiji ($48,305, a difference of 0.040%), Assyrian/Chaldean/Syriac ($48,304, a difference of 0.040%), Immigrants from Philippines ($48,266, a difference of 0.040%), Pakistani ($48,254, a difference of 0.070%), and Zimbabwean ($48,229, a difference of 0.12%).
| Demographics | Rating | Rank | Median Earnings |
| Carpatho Rusyns | 95.5 /100 | #120 | Exceptional $48,617 |
| Arabs | 95.4 /100 | #121 | Exceptional $48,599 |
| Chileans | 94.8 /100 | #122 | Exceptional $48,504 |
| Immigrants | Syria | 93.9 /100 | #123 | Exceptional $48,375 |
| Brazilians | 93.7 /100 | #124 | Exceptional $48,356 |
| Immigrants | Fiji | 93.3 /100 | #125 | Exceptional $48,305 |
| Assyrians/Chaldeans/Syriacs | 93.3 /100 | #126 | Exceptional $48,304 |
| Sierra Leoneans | 93.1 /100 | #127 | Exceptional $48,286 |
| Immigrants | Philippines | 92.9 /100 | #128 | Exceptional $48,266 |
| Pakistanis | 92.8 /100 | #129 | Exceptional $48,254 |
| Zimbabweans | 92.6 /100 | #130 | Exceptional $48,229 |
| Lebanese | 92.5 /100 | #131 | Exceptional $48,226 |
| British | 92.2 /100 | #132 | Exceptional $48,189 |
| Immigrants | Uganda | 90.5 /100 | #133 | Exceptional $48,041 |
| Sri Lankans | 90.5 /100 | #134 | Exceptional $48,040 |