Immigrants from Bangladesh vs Immigrants from North Macedonia Median Household Income
COMPARE
Immigrants from Bangladesh
Immigrants from North Macedonia
Median Household Income
Median Household Income Comparison
Immigrants from Bangladesh
Immigrants from North Macedonia
$80,722
MEDIAN HOUSEHOLD INCOME
5.7/ 100
METRIC RATING
228th/ 347
METRIC RANK
$89,741
MEDIAN HOUSEHOLD INCOME
95.2/ 100
METRIC RATING
120th/ 347
METRIC RANK
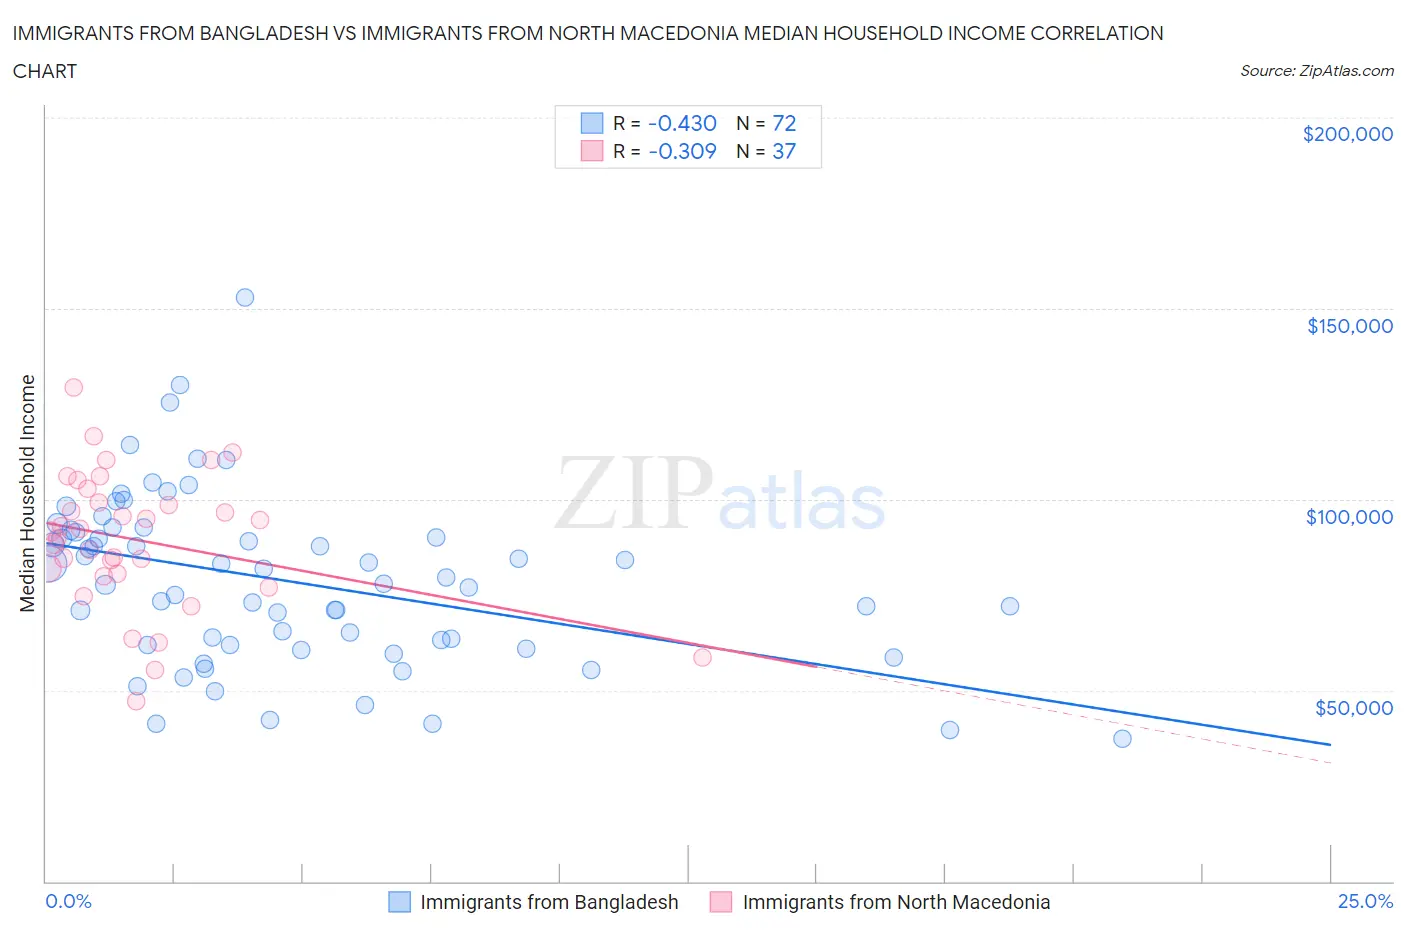
Immigrants from Bangladesh vs Immigrants from North Macedonia Median Household Income Correlation Chart
The statistical analysis conducted on geographies consisting of 203,518,199 people shows a moderate negative correlation between the proportion of Immigrants from Bangladesh and median household income in the United States with a correlation coefficient (R) of -0.430 and weighted average of $80,722. Similarly, the statistical analysis conducted on geographies consisting of 74,304,962 people shows a mild negative correlation between the proportion of Immigrants from North Macedonia and median household income in the United States with a correlation coefficient (R) of -0.309 and weighted average of $89,741, a difference of 11.2%.
Median Household Income Correlation Summary
| Measurement | Immigrants from Bangladesh | Immigrants from North Macedonia |
| Minimum | $37,309 | $47,094 |
| Maximum | $152,768 | $129,437 |
| Range | $115,459 | $82,343 |
| Mean | $78,626 | $89,408 |
| Median | $78,708 | $91,504 |
| Interquartile 25% (IQ1) | $61,856 | $80,151 |
| Interquartile 75% (IQ3) | $91,563 | $100,949 |
| Interquartile Range (IQR) | $29,707 | $20,798 |
| Standard Deviation (Sample) | $22,431 | $17,826 |
| Standard Deviation (Population) | $22,274 | $17,584 |
Similar Demographics by Median Household Income
Demographics Similar to Immigrants from Bangladesh by Median Household Income
In terms of median household income, the demographic groups most similar to Immigrants from Bangladesh are Guyanese ($80,734, a difference of 0.010%), Immigrants from Panama ($80,873, a difference of 0.19%), Delaware ($80,527, a difference of 0.24%), Scotch-Irish ($80,972, a difference of 0.31%), and Bermudan ($80,406, a difference of 0.39%).
| Demographics | Rating | Rank | Median Household Income |
| Immigrants | Ghana | 9.0 /100 | #221 | Tragic $81,489 |
| Immigrants | Nigeria | 7.7 /100 | #222 | Tragic $81,236 |
| Immigrants | El Salvador | 7.6 /100 | #223 | Tragic $81,213 |
| Malaysians | 7.0 /100 | #224 | Tragic $81,064 |
| Scotch-Irish | 6.6 /100 | #225 | Tragic $80,972 |
| Immigrants | Panama | 6.2 /100 | #226 | Tragic $80,873 |
| Guyanese | 5.7 /100 | #227 | Tragic $80,734 |
| Immigrants | Bangladesh | 5.7 /100 | #228 | Tragic $80,722 |
| Delaware | 5.0 /100 | #229 | Tragic $80,527 |
| Bermudans | 4.7 /100 | #230 | Tragic $80,406 |
| Trinidadians and Tobagonians | 4.7 /100 | #231 | Tragic $80,402 |
| Immigrants | Trinidad and Tobago | 4.6 /100 | #232 | Tragic $80,373 |
| Immigrants | Azores | 4.5 /100 | #233 | Tragic $80,357 |
| Immigrants | Ecuador | 4.5 /100 | #234 | Tragic $80,341 |
| Immigrants | Guyana | 4.5 /100 | #235 | Tragic $80,324 |
Demographics Similar to Immigrants from North Macedonia by Median Household Income
In terms of median household income, the demographic groups most similar to Immigrants from North Macedonia are Albanian ($89,744, a difference of 0.0%), Syrian ($89,830, a difference of 0.10%), Ethiopian ($89,640, a difference of 0.11%), Pakistani ($89,638, a difference of 0.11%), and Taiwanese ($89,900, a difference of 0.18%).
| Demographics | Rating | Rank | Median Household Income |
| Peruvians | 96.5 /100 | #113 | Exceptional $90,261 |
| Immigrants | Northern Africa | 95.9 /100 | #114 | Exceptional $90,026 |
| Immigrants | Western Asia | 95.9 /100 | #115 | Exceptional $90,005 |
| Native Hawaiians | 95.7 /100 | #116 | Exceptional $89,919 |
| Taiwanese | 95.6 /100 | #117 | Exceptional $89,900 |
| Syrians | 95.4 /100 | #118 | Exceptional $89,830 |
| Albanians | 95.2 /100 | #119 | Exceptional $89,744 |
| Immigrants | North Macedonia | 95.2 /100 | #120 | Exceptional $89,741 |
| Ethiopians | 94.9 /100 | #121 | Exceptional $89,640 |
| Pakistanis | 94.8 /100 | #122 | Exceptional $89,638 |
| Immigrants | Zimbabwe | 94.4 /100 | #123 | Exceptional $89,496 |
| Immigrants | Jordan | 94.1 /100 | #124 | Exceptional $89,412 |
| Immigrants | Kuwait | 93.5 /100 | #125 | Exceptional $89,263 |
| Immigrants | Oceania | 92.9 /100 | #126 | Exceptional $89,100 |
| Immigrants | Peru | 92.5 /100 | #127 | Exceptional $89,010 |