Immigrants from Bangladesh vs Hopi Median Household Income
COMPARE
Immigrants from Bangladesh
Hopi
Median Household Income
Median Household Income Comparison
Immigrants from Bangladesh
Hopi
$80,722
MEDIAN HOUSEHOLD INCOME
5.7/ 100
METRIC RATING
228th/ 347
METRIC RANK
$65,043
MEDIAN HOUSEHOLD INCOME
0.0/ 100
METRIC RATING
339th/ 347
METRIC RANK
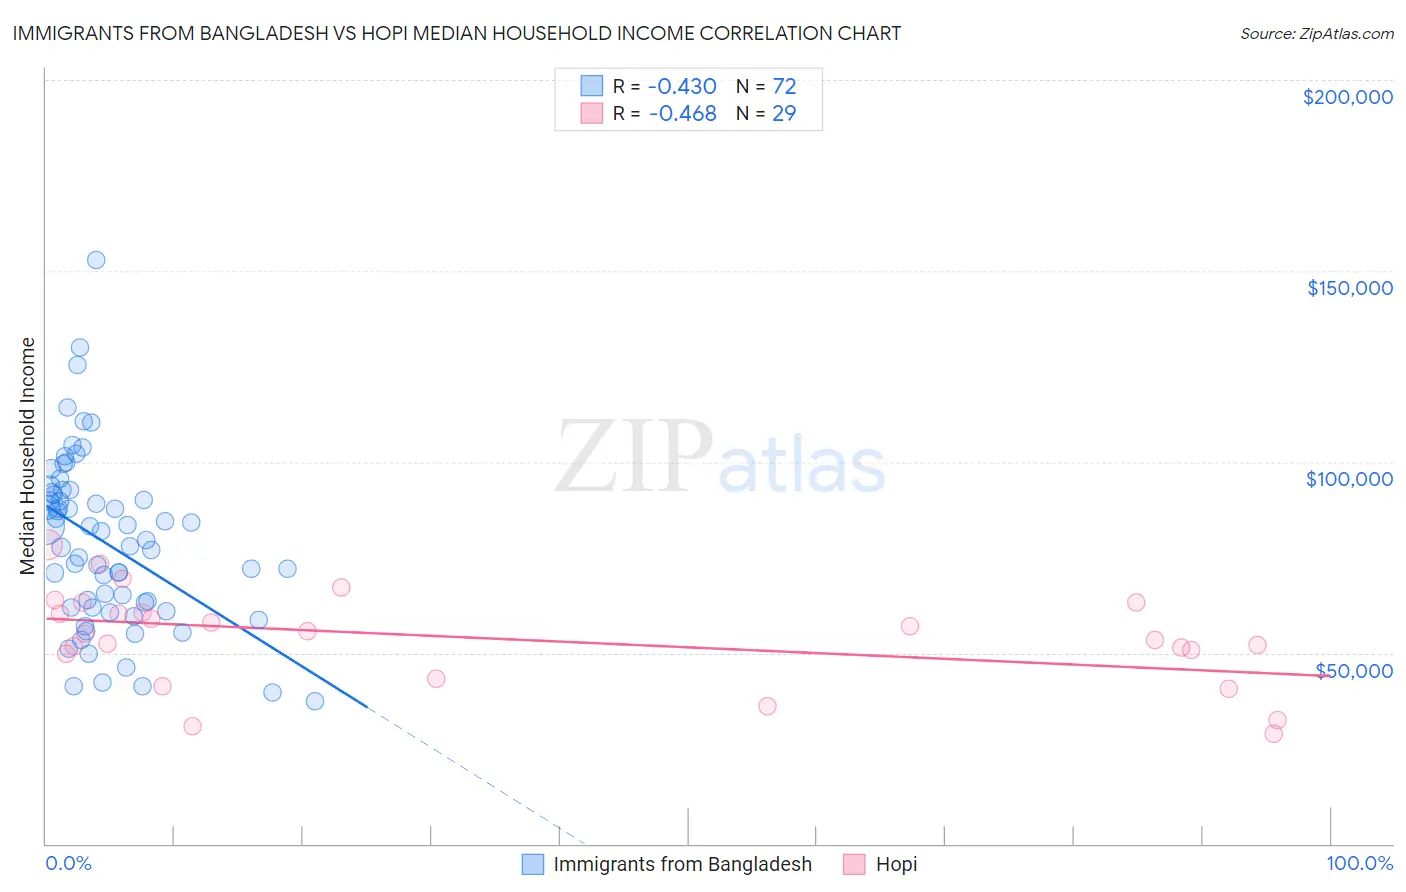
Immigrants from Bangladesh vs Hopi Median Household Income Correlation Chart
The statistical analysis conducted on geographies consisting of 203,518,199 people shows a moderate negative correlation between the proportion of Immigrants from Bangladesh and median household income in the United States with a correlation coefficient (R) of -0.430 and weighted average of $80,722. Similarly, the statistical analysis conducted on geographies consisting of 74,731,446 people shows a moderate negative correlation between the proportion of Hopi and median household income in the United States with a correlation coefficient (R) of -0.468 and weighted average of $65,043, a difference of 24.1%.
Median Household Income Correlation Summary
| Measurement | Immigrants from Bangladesh | Hopi |
| Minimum | $37,309 | $28,831 |
| Maximum | $152,768 | $78,310 |
| Range | $115,459 | $49,479 |
| Mean | $78,626 | $53,752 |
| Median | $78,708 | $55,122 |
| Interquartile 25% (IQ1) | $61,856 | $46,511 |
| Interquartile 75% (IQ3) | $91,563 | $61,881 |
| Interquartile Range (IQR) | $29,707 | $15,370 |
| Standard Deviation (Sample) | $22,431 | $12,388 |
| Standard Deviation (Population) | $22,274 | $12,173 |
Similar Demographics by Median Household Income
Demographics Similar to Immigrants from Bangladesh by Median Household Income
In terms of median household income, the demographic groups most similar to Immigrants from Bangladesh are Guyanese ($80,734, a difference of 0.010%), Immigrants from Panama ($80,873, a difference of 0.19%), Delaware ($80,527, a difference of 0.24%), Scotch-Irish ($80,972, a difference of 0.31%), and Bermudan ($80,406, a difference of 0.39%).
| Demographics | Rating | Rank | Median Household Income |
| Immigrants | Ghana | 9.0 /100 | #221 | Tragic $81,489 |
| Immigrants | Nigeria | 7.7 /100 | #222 | Tragic $81,236 |
| Immigrants | El Salvador | 7.6 /100 | #223 | Tragic $81,213 |
| Malaysians | 7.0 /100 | #224 | Tragic $81,064 |
| Scotch-Irish | 6.6 /100 | #225 | Tragic $80,972 |
| Immigrants | Panama | 6.2 /100 | #226 | Tragic $80,873 |
| Guyanese | 5.7 /100 | #227 | Tragic $80,734 |
| Immigrants | Bangladesh | 5.7 /100 | #228 | Tragic $80,722 |
| Delaware | 5.0 /100 | #229 | Tragic $80,527 |
| Bermudans | 4.7 /100 | #230 | Tragic $80,406 |
| Trinidadians and Tobagonians | 4.7 /100 | #231 | Tragic $80,402 |
| Immigrants | Trinidad and Tobago | 4.6 /100 | #232 | Tragic $80,373 |
| Immigrants | Azores | 4.5 /100 | #233 | Tragic $80,357 |
| Immigrants | Ecuador | 4.5 /100 | #234 | Tragic $80,341 |
| Immigrants | Guyana | 4.5 /100 | #235 | Tragic $80,324 |
Demographics Similar to Hopi by Median Household Income
In terms of median household income, the demographic groups most similar to Hopi are Immigrants from Yemen ($65,194, a difference of 0.23%), Pueblo ($64,692, a difference of 0.54%), Kiowa ($65,914, a difference of 1.3%), Crow ($63,681, a difference of 2.1%), and Immigrants from Congo ($66,768, a difference of 2.6%).
| Demographics | Rating | Rank | Median Household Income |
| Sioux | 0.0 /100 | #332 | Tragic $67,792 |
| Creek | 0.0 /100 | #333 | Tragic $67,715 |
| Blacks/African Americans | 0.0 /100 | #334 | Tragic $67,573 |
| Cheyenne | 0.0 /100 | #335 | Tragic $66,974 |
| Immigrants | Congo | 0.0 /100 | #336 | Tragic $66,768 |
| Kiowa | 0.0 /100 | #337 | Tragic $65,914 |
| Immigrants | Yemen | 0.0 /100 | #338 | Tragic $65,194 |
| Hopi | 0.0 /100 | #339 | Tragic $65,043 |
| Pueblo | 0.0 /100 | #340 | Tragic $64,692 |
| Crow | 0.0 /100 | #341 | Tragic $63,681 |
| Pima | 0.0 /100 | #342 | Tragic $63,262 |
| Houma | 0.0 /100 | #343 | Tragic $62,575 |
| Tohono O'odham | 0.0 /100 | #344 | Tragic $61,663 |
| Puerto Ricans | 0.0 /100 | #345 | Tragic $59,197 |
| Navajo | 0.0 /100 | #346 | Tragic $59,159 |