Immigrants from Bangladesh vs Armenian Median Earnings
COMPARE
Immigrants from Bangladesh
Armenian
Median Earnings
Median Earnings Comparison
Immigrants from Bangladesh
Armenians
$45,532
MEDIAN EARNINGS
22.0/ 100
METRIC RATING
215th/ 347
METRIC RANK
$49,804
MEDIAN EARNINGS
99.1/ 100
METRIC RATING
93rd/ 347
METRIC RANK
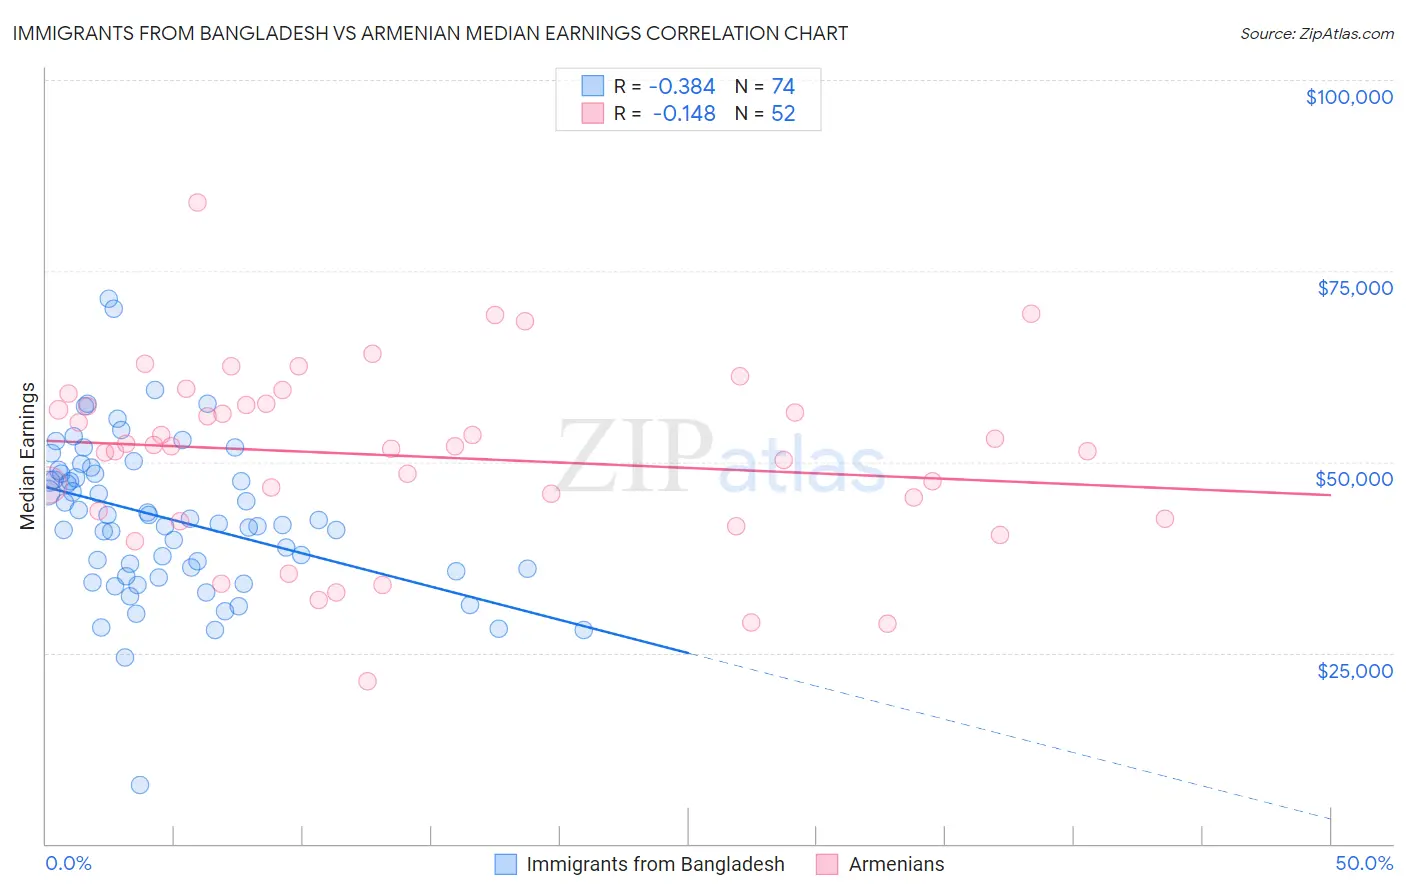
Immigrants from Bangladesh vs Armenian Median Earnings Correlation Chart
The statistical analysis conducted on geographies consisting of 203,670,623 people shows a mild negative correlation between the proportion of Immigrants from Bangladesh and median earnings in the United States with a correlation coefficient (R) of -0.384 and weighted average of $45,532. Similarly, the statistical analysis conducted on geographies consisting of 310,945,861 people shows a poor negative correlation between the proportion of Armenians and median earnings in the United States with a correlation coefficient (R) of -0.148 and weighted average of $49,804, a difference of 9.4%.
Median Earnings Correlation Summary
| Measurement | Immigrants from Bangladesh | Armenian |
| Minimum | $7,703 | $21,250 |
| Maximum | $71,366 | $84,019 |
| Range | $63,663 | $62,769 |
| Mean | $42,517 | $50,725 |
| Median | $42,193 | $52,028 |
| Interquartile 25% (IQ1) | $35,657 | $43,022 |
| Interquartile 75% (IQ3) | $48,515 | $57,580 |
| Interquartile Range (IQR) | $12,858 | $14,558 |
| Standard Deviation (Sample) | $10,295 | $11,922 |
| Standard Deviation (Population) | $10,225 | $11,807 |
Similar Demographics by Median Earnings
Demographics Similar to Immigrants from Bangladesh by Median Earnings
In terms of median earnings, the demographic groups most similar to Immigrants from Bangladesh are Nigerian ($45,532, a difference of 0.0%), Immigrants from Colombia ($45,550, a difference of 0.040%), Panamanian ($45,593, a difference of 0.13%), Bermudan ($45,593, a difference of 0.13%), and Immigrants from Grenada ($45,596, a difference of 0.14%).
| Demographics | Rating | Rank | Median Earnings |
| Immigrants | Bosnia and Herzegovina | 23.7 /100 | #208 | Fair $45,600 |
| Immigrants | Thailand | 23.7 /100 | #209 | Fair $45,598 |
| Immigrants | Grenada | 23.6 /100 | #210 | Fair $45,596 |
| Panamanians | 23.5 /100 | #211 | Fair $45,593 |
| Bermudans | 23.5 /100 | #212 | Fair $45,593 |
| Immigrants | Colombia | 22.4 /100 | #213 | Fair $45,550 |
| Nigerians | 22.0 /100 | #214 | Fair $45,532 |
| Immigrants | Bangladesh | 22.0 /100 | #215 | Fair $45,532 |
| Guyanese | 20.6 /100 | #216 | Fair $45,470 |
| Tlingit-Haida | 20.5 /100 | #217 | Fair $45,468 |
| Spanish | 19.7 /100 | #218 | Poor $45,432 |
| Dutch | 18.4 /100 | #219 | Poor $45,370 |
| Ecuadorians | 15.3 /100 | #220 | Poor $45,214 |
| Immigrants | Guyana | 15.1 /100 | #221 | Poor $45,204 |
| Immigrants | Panama | 15.0 /100 | #222 | Poor $45,198 |
Demographics Similar to Armenians by Median Earnings
In terms of median earnings, the demographic groups most similar to Armenians are Immigrants from Argentina ($49,841, a difference of 0.070%), Croatian ($49,724, a difference of 0.16%), Immigrants from England ($49,722, a difference of 0.16%), Macedonian ($49,893, a difference of 0.18%), and Italian ($49,915, a difference of 0.22%).
| Demographics | Rating | Rank | Median Earnings |
| Immigrants | Canada | 99.5 /100 | #86 | Exceptional $50,192 |
| Immigrants | Uzbekistan | 99.5 /100 | #87 | Exceptional $50,151 |
| Albanians | 99.4 /100 | #88 | Exceptional $50,116 |
| Immigrants | North America | 99.4 /100 | #89 | Exceptional $50,108 |
| Italians | 99.3 /100 | #90 | Exceptional $49,915 |
| Macedonians | 99.2 /100 | #91 | Exceptional $49,893 |
| Immigrants | Argentina | 99.2 /100 | #92 | Exceptional $49,841 |
| Armenians | 99.1 /100 | #93 | Exceptional $49,804 |
| Croatians | 99.0 /100 | #94 | Exceptional $49,724 |
| Immigrants | England | 99.0 /100 | #95 | Exceptional $49,722 |
| Immigrants | Lebanon | 99.0 /100 | #96 | Exceptional $49,682 |
| Immigrants | North Macedonia | 98.9 /100 | #97 | Exceptional $49,658 |
| Immigrants | Northern Africa | 98.9 /100 | #98 | Exceptional $49,648 |
| Immigrants | Afghanistan | 98.9 /100 | #99 | Exceptional $49,645 |
| Immigrants | Poland | 98.9 /100 | #100 | Exceptional $49,633 |